Switching from Pulley? We’re helping hundreds of companies transition quickly and securely. Talk to our team ❯
Switching from Pulley? We’re helping hundreds of companies transition quickly and securely. Talk to our team ❯


This report is issued by and on behalf of altshare Ltd. ("altshare") for informational purposes only and shall not be construed as legal,
financial, or tax advice.
The information contained in this report is based on data provided to and/or prepared by altshare for its clients. The report is based on
an aggregated and anonymized data from altshare's clients.
While this report may address potential legal, financial, and/or tax matters, it does not constitute professional advice in these areas.
The opinions or conclusions expressed herein are not to be attributed to altshare. We strongly recommend that you seek the counsel
of qualified advisors before taking any actions based on the information provided in this report.
For the avoidance of doubt, altshare shall not assume any liability for, nor be held responsible for any damages, losses, claims, or
expenses, whether direct, indirect, incidental, consequential, special, or punitive, arising from the use or reliance on the information
contained in this report. altshare shall not be liable for any actions taken or not taken based on the information contained herein.
altshare does not warrant the accuracy, completeness, or reliability of the data presented and assumes no responsibility for any errors
or omissions. The information provided in this report is subject to change without notice.
This report is provided "as is" and altshare disclaims any responsibility for the outcomes of decisions made by the recipient or any third
party in reliance on its contents.
• Equity Fundraising and Valuations Overview
Seed medians closed 2025 steady, not surging. Q4 reached $6.0M in median investment and $12.3M in median pre-money valuation. Beneath the headline, momentum was uneven, with AI and Cyber leading activity while other sectors lagged.
Looking ahead, our model forecasts a brief pause in Q1 2026 at $5.0M investment and $10.7M pre-money, followed by a measured rebound in Q2 to $5.3M and $11.7M, assuming improving macro conditions and a lower cost of capital.

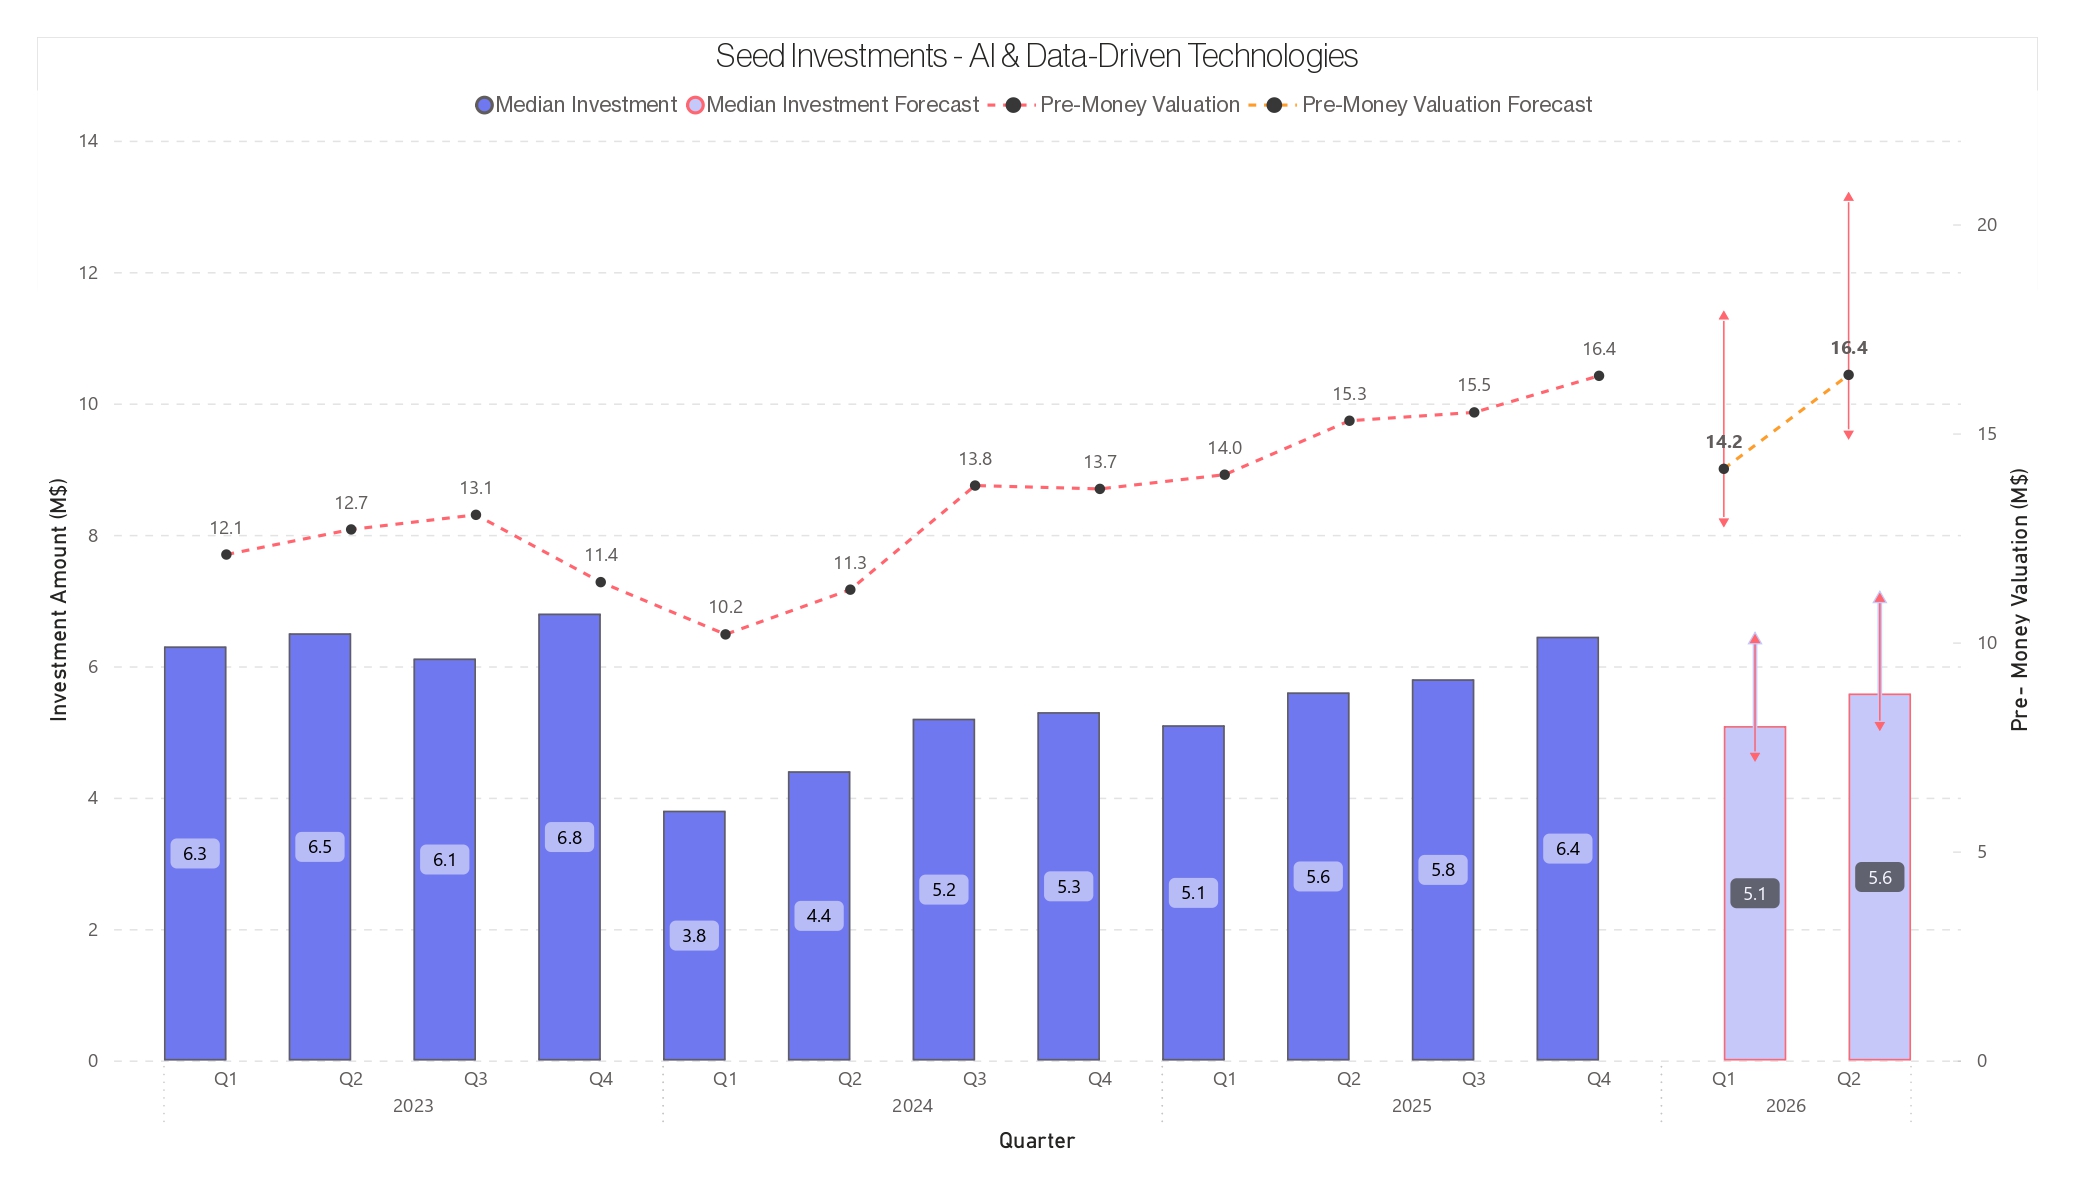
AI momentum at Seed peaked in Q4 2025, as investors leaned into the strongest applied AI teams. Median investment reached $6.4M, with median
pre-money climbing to $16.4M. Our model suggests a brief cooldown in Q1 2026 at $5.1M and $14.2M, followed by a rebound in Q2 to $5.6M and
$16.4%, assuming demand for top teams stays strong.
Cybersecurity Seed stayed on a steady climb into year-end. In Q4 2025, median Seed rounds reached $7.2M with a $14.6M median pre-money,
underscoring Cyber’s role as a dependable category even as broader markets softened. Heading into 2026, the outlook remains positive but
measured. We expect a small pullback in Q1 to $6.2M and $13.0M, followed by a rebound in Q2 to $6.8M and $14.7M. Longer-term upside will hinge
on healthier exit and M&A activity to support a growing wave of new companies.

HealthTech moved at its own pace toward the end of 2025. Seed activity stayed quiet, with Q4 median investment holding near $3.4M while median
pre-money eased to $8.0M. The dynamic reflects a sector guided less by short-term market swings and more by the realities of clinical progress and
regulatory timelines. Looking ahead, that steady rhythm continues into 2026. The outlook for H1 is flat to slightly positive, with Q1 at $3.1M investment
and $7.5M pre-money, followed by a modest step up in Q2 to $3.3M and $8.3M as programs advance and milestones come into view.

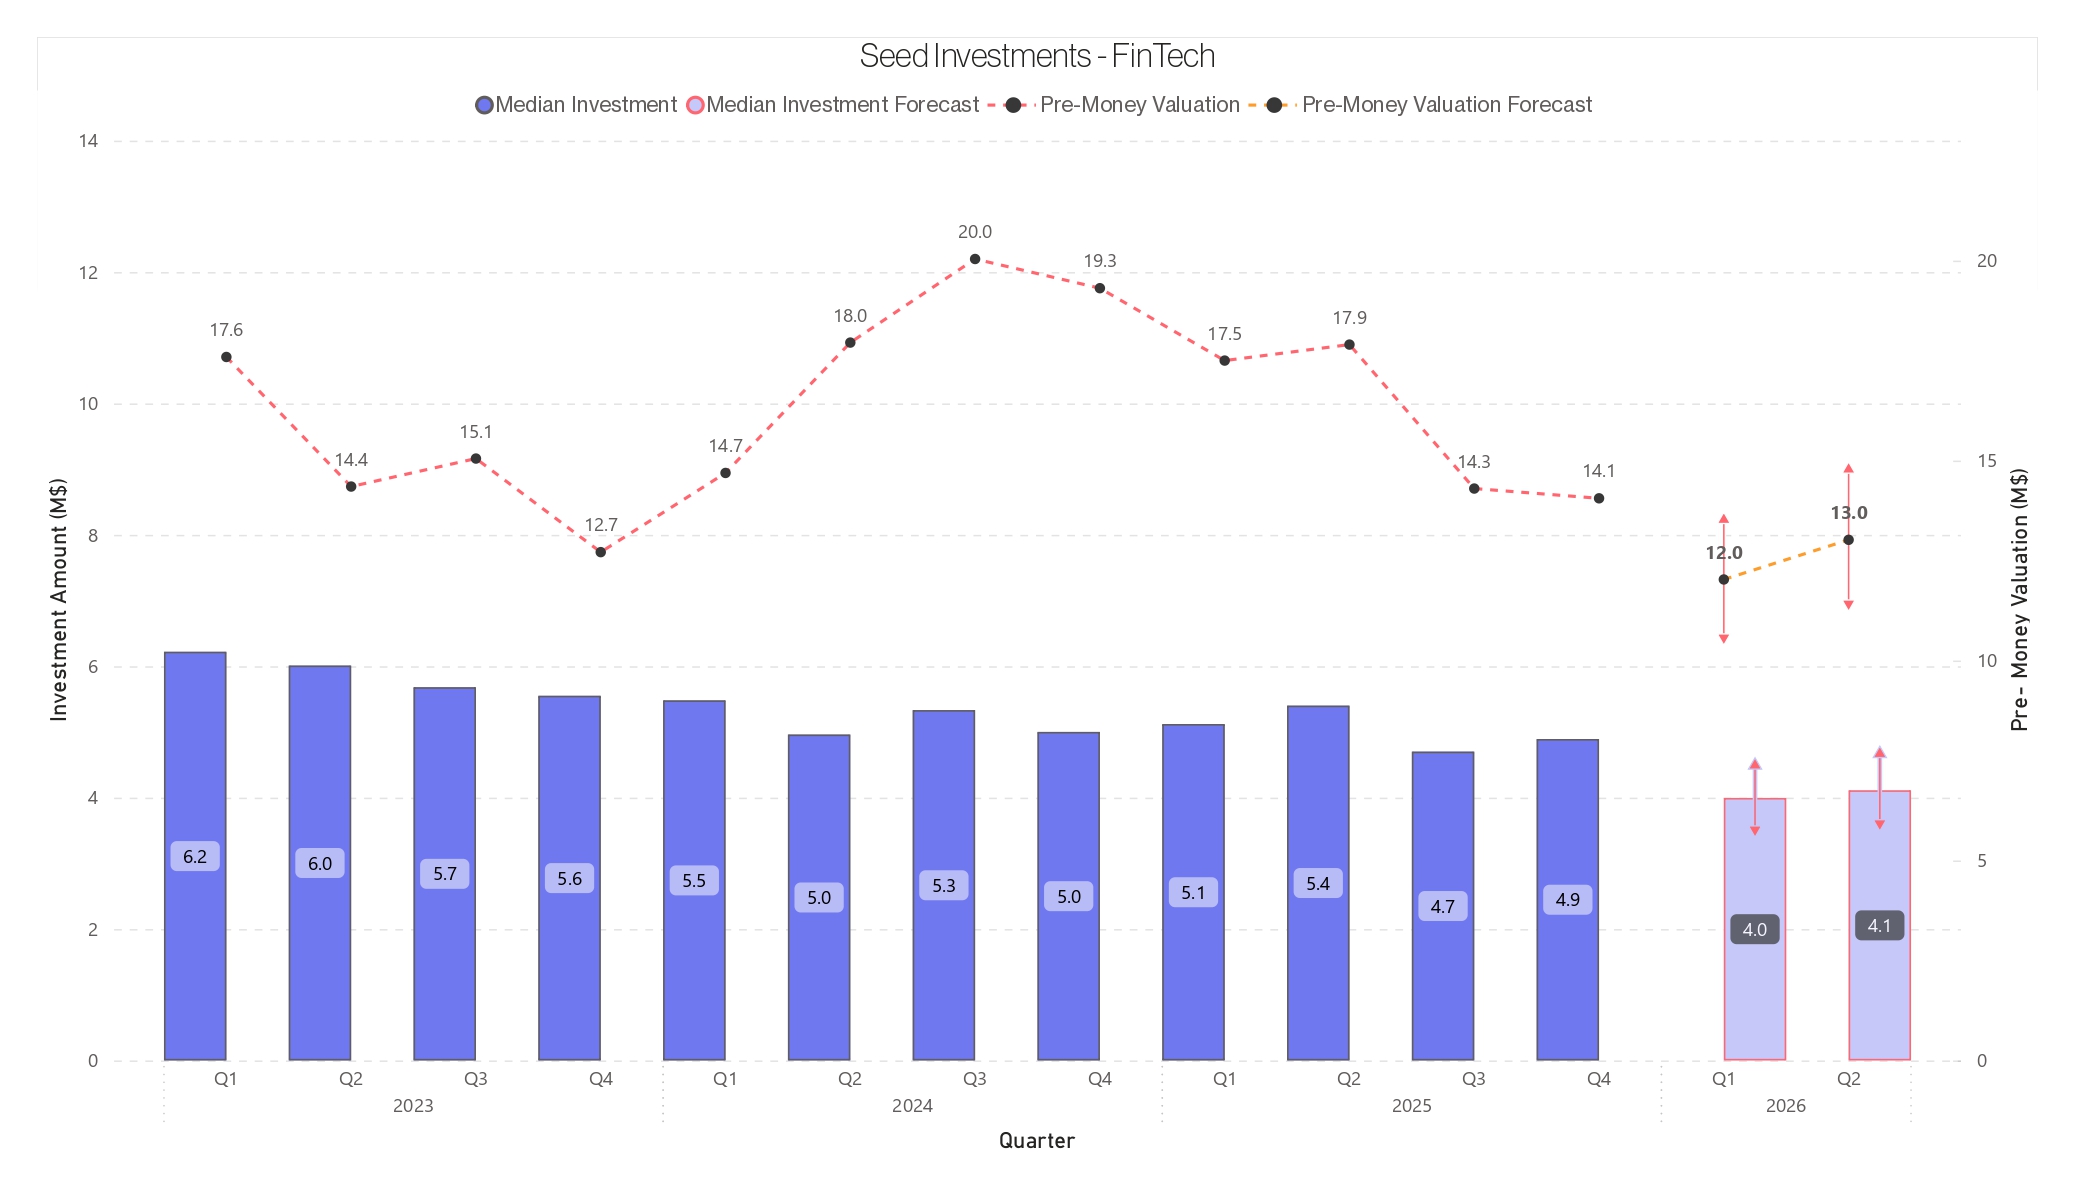
Fintech Seed ended 2025 balanced. Q4 median rounds held near $4.9M, with median pre-money at $14.1M, signaling stabilization rather than a
rebound. Looking ahead, our 2026 outlook remains cautious, with a Q1 reset to $4.0M and $12.0M, followed by a modest Q2 lift to $4.1M and $13.0M.
Series A closed 2025 with a clear shift toward quality. In Q4, median check sizes jumped to $12.8M, while median pre-money stayed essentially flat at $38.3M, pointing to capital concentrating in fewer, higher-conviction rounds. Looking ahead, we expect a reset in Q1 2026, with round sizes easing to $10.1M alongside stable valuations near $38.0M, before a Q2 re-rating as valuations expand to $44.4M and checks settle around $10.5M.

AI ended 2025 on a high note. In Q4, median Series A rounds jumped to $22.0M, with median pre-money reaching $58.3M, a clear sign that investors are still willing to pay up for the strongest AI companies. After a strong finish, we expect some normalization in early 2026, with Q1 easing to $19.0M and $49.0M. Momentum picks back up in Q2, with median rounds rebounding to $23.1M and pre-money climbing to $59.8M as demand for top-tier AI remains intact.

Cyber Series A is still priced at the top of the market, even as deal terms tighten.
In Q4 2025, median pre-money climbed to $84.4M, while median check size landed at $19.9M, reinforcing a clear “high price, less cash” pattern.
That dynamic looks set to continue into 2026. Q1 checks are expected to dip to $14.6M even as valuations stay elevated at $73.4M, with Q2 bringing
a valuation rebound to $83.7M while check sizes remain roughly flat at $14.7M.

HealthTech Series A continues to move at a slower, more deliberate pace. Investors are leaning into deeper, R&D-heavy programs, while lighter
digital health plays face longer decision cycles. In Q4 2025, median rounds held at $4.8M with median pre-money at $21.3M, signaling stability but
limited momentum. That pattern extends into 2026. We expect Q1 to soften to $4.3M investment and $20.6M pre-money, followed by a Q2 lift in
valuations to $23.0M, even as check sizes remain tight at $4.0M.
Fintech Series A is settling into its new normal. In Q4 2025, median rounds inched up to $6.8M while pre-money dipped to $33.2M, showing that
investors are still writing checks, just more carefully. Looking into 2026, rounds are expected to stay smaller at first, with valuations recovering as
capital flows toward teams that have earned conviction.
15Setting the Stage for 2026
Summary
The final months of 2025 marked a clear turn in market activity. Deal flow picked up meaningfully, setting a constructive foundation for 2026. A
brief pause is likely in Q1 as investors and companies reset, followed by broader momentum in Q2 as financial conditions ease. Leadership
remains concentrated. AI and Cyber continue to command premium pricing, while Fintech and HealthTech move through a slower reset, shifting
toward more disciplined, efficiency-driven growth.
Takeaway
The market is no longer frozen, but it is no longer forgiving. Capital has returned selectively. Checks are tighter, timelines are longer, and diligence is
deeper. Investors are backing companies with durable unit economics, operational discipline, and credible paths to profitability. Growth alone is no
longer enough. Execution now determines access to capital and pricing power.
Insight
A structural divide is emerging. The market is entering a K-shaped recovery, with top-tier companies pulling ahead while others recover more
slowly or stall, reflecting where capital is flowing and how selectively it is being deployed. Demand-driven sectors such as AI and Cyber continue to
attract capital at premium valuations, while Fintech and HealthTech work through consolidation and stricter filtering. The next phase of recovery is
likely to reward quality first, creating an opportunity to identify strong companies in recovering sectors before valuations fully adjust. 16Section A – Part 2 The State of Median SAFE Rounds
Median SAFE round sizes at the earliest stages have shown little
change despite broader market swings. Since early 2023,
median pre-seed rounds have stayed within a narrow band of
$1.2M to $1.5M, ending Q4 2025 at $1.5M.
Seed rounds followed a similar pattern, remaining between
$2.5M and $3.0M and closing the year at $2.8M.
The typical 2× step-up from pre-seed to seed remains intact,
signaling stability rather than repricing.
17Section A – Part 3 Distribution of Number of Founders per Company
Most startups are founded by two or three people, with solo
founders representing a smaller but still meaningful share.
Teams of four or more are comparatively rare. The data
points to an advantage for smaller, complementary founding
teams, large enough to cover core functions like product,
engineering, and go-to-market, yet small enough to maintain
alignment.
This structure tends to support clearer decision-making and
more balanced equity outcomes than either solo founders
or larger teams.
18Section A – Part 3 Founders Ownership & Employee Pool Percentages by Funding Round
Each funding round reshapes the cap table in predictable
ways. As companies progress from pre-seed through Series
C, founder ownership steadily declines while employee
option pools expand, reflecting the compounding effects of
capital raises and team growth.
Early decisions matter. Larger option pools set in the earliest
rounds tend to reduce the need for major refreshes later,
while smaller initial pools are more likely to expand over time.
The result is a consistent shift in ownership that highlights
how dilution and hiring scale together across successive
rounds.
19Section A – Part 4 Median Secondary Transactions By Sector – Series A
20Section A – Part 4 Median Secondary Transactions By Sector – Series B
21Secondaries Are Now Part of the Playbook
These slides analyze median secondary sale sizes, measured as a percentage of holdings, for founders and employees at the Series A and Series B
stages across sectors from 2022 to 2025. The analysis focuses only on material transactions, defined as sales exceeding 2.5 percent of individual
holdings.
The results are consistent. Secondary activity increases meaningfully from Series A to Series B, and employees sell a larger share than founders
across all sectors. This reflects higher vesting levels, deeper buyer demand, and more formalized liquidity programs at later stages. Sector
leadership remains stable, with FinTech showing the highest secondary activity, followed by Cybersecurity and AI and Data, while HealthTech
remains the most conservative.
The 2025 data reinforces this pattern. At Series A, employee liquidity continues to exceed founder liquidity across sectors, with activity concentrated
in FinTech and more limited participation in HealthTech. By Series B, secondary programs are more established and broadly accessible, resulting in
a clear step-up in sale sizes for both employees and founders.
Overall, secondary participation has continued to expand since 2023, particularly among employees, pointing to a market that is maturing into a
more structured, sector-differentiated liquidity environment rather than episodic activity.
22Section A – Part 5 Revenue Multiples - By Sector and Year
These charts show how forward revenue multiples have evolved by
sector from H1 2022 through H2 2025. After a broad reset in 2022,
the market has settled into a more thoughtful recovery.
AI and Data–Driven companies now sit at the top, reflecting steady
confidence in enterprise adoption and long-term growth.
Cybersecurity has held up well throughout, supported by ongoing
demand and resilient budgets. HealthTech continues to lag more
software-heavy sectors, though valuations have improved as
business models mature. FinTech, which faced some of the earliest
pressure from macro and regulatory shifts, looks more stable in 2025
as investors reward cleaner execution and stronger fundamentals.
Overall, today’s multiples reflect clearer preferences and better
discipline, not a return to indiscriminate pricing.
23Section A – Part 6 Changes in Time to Liquidity
The following chart shows how exit timelines have shifted across recent cycles, comparing companies that exited on schedule with those that
delayed by one year or more. One-year delays became the default outcome, with the tendency to “push by a year” peaking in the 2023–2024 period
as many teams extended runway, waited for improved pricing, and chose to defer liquidity rather than force an exit.
By 2024–2025, the pattern looks more balanced. A larger share of companies are moving forward as planned, and one-year delays are less
dominant, pointing to improved confidence and a clearer willingness to commit to timing. Multi-year deferrals remain a smaller share overall and, when
they occur, typically reflect a deliberate choice to wait for stronger scale, metrics, or a more compelling exit path. Overall, founders appear less stuck in
wait mode and more decisive about whether liquidity is a near-term goal or a longer-term strategy.
24Section A – Part 6 Changes in Time to Liquidity
25Section B
• Grants Overview
26Section B – Part 1 Trends in Grant Distribution Gender
This chart shows how equity grants are split by gender across sectors from 2022 to 2025. Overall, men receive a larger share of equity grants, at
roughly a two-thirds to one-third split, though the size of the gap varies by sector.
Health Tech and Life Sciences, along with Agri and Food Tech, show the most balanced distribution. Cybersecurity, Business Software, and
Industrial and Energy remain more male-heavy. The data suggests these differences reflect sector-specific hiring patterns and seniority mix rather
than a broad market-wide shift.
27Section B – Part 1 Trends in Grant Distribution Gender
This breakdown shows how the gender mix changes by age group within each sector from 2022 to 2025. The pattern is consistent across the data.
Younger age groups are more balanced, particularly in Health Tech and Life Sciences and Agri and Food Tech. In contrast, Cybersecurity, Business
Software, and Industrial and Energy remain male-heavy across every age group. The imbalance increases with seniority. The 51+ age group is the most
male-weighted across sectors, suggesting that the gap widens more with experience and tenure than with shifts in sector cycles.
28Section B – Part 2 Accumulated Grant Distribution
Equity grants are concentrated among mid-career employees, particularly those aged 31–50, across sectors from 2022 to 2025. Employees
under 30 account for a smaller share of grants across most sectors.
The age mix differs by sector. Cybersecurity has a higher share of grants going to younger employees, Business Software and Media are
concentrated in the 31–40 range, and Agriculture and Food Tech has the largest share of grants going to employees aged 51 and older.
29Section B – Part 2 Trends in Grant Distribution by Age Group
This chart shows how equity grant allocation has shifted by age across all sectors from 2022 to 2025. Over time, grants have moved toward older
age groups, with the share going to employees under 30 declining while the 51+ group has grown into a larger portion of total grants.
Mid-career employees, particularly those aged 31–50, continue to receive the majority of the equity. However, the balance is gradually moving
toward more experienced talent, reflecting a broader shift toward execution, stability, and operating experience as the market matures.
30Section B – Part 2 Percentage of Grants by Age Group and Sectors
The following chart shows that equity allocation has shifted older over time, with clear differences across sectors between 2022 and 2025. The
share of grants going to employees under 30 continues to decline, while the 51+ group has grown into a larger part of the overall grant base.
Sector patterns are distinct. Business Software and Cybersecurity remain centered on the 31-40 age group, while Fintech and Industrial and
Energy allocate a larger share to older employees, including a sizable 51+ population. Health Tech shows a similar move toward more senior
recipients, pointing to a broader emphasis on experience as companies mature and execution becomes a higher priority.
31Section B – Part 2 Percentage of Grants by Age Group and Sectors
32Section B – Part 3 Trends in Grant Distribution by Sectors
33Section B – Part 3 Trends in Grant Distribution by Sectors
Equity grants have shifted meaningfully by sector over the past four years. Fintech & Insurtech steadily take up a larger share of total grants,
signaling growing focus on the category. HealthTech and Industrial & Energy move in the opposite direction, accounting for a smaller portion
than in earlier years. Business Software remains largely stable after a brief dip, while Cybersecurity holds a consistent middle position.
At the same time, the rise in *Other Sectors suggests grant activity is spreading beyond the core categories, pointing to a broader and more
diversified allocation landscape.
*Other Sectors: Automotive & Mobility, Aerospace & Defense, AgriTech & FoodTech.
34Section B – Part 3 Trends in Grant Distribution by Sectors
35Section B – Part 3 Trends in Grant Distribution by Sectors
This view focuses on employees age 30 and under and shows how equity grants are distributed across sectors over time. The clearest shift is
diversification: grants to younger employees are spreading beyond a handful of core categories, with Other Sectors steadily gaining share.
Within the main sectors, Cybersecurity and Fintech remain consistently prominent, while Business Software plays a smaller role than in earlier
years. HealthTech and Industrial & Energy also trend lower within this age group.
Overall, early equity is increasingly flowing to faster-moving, talent-dense sectors and a broader long tail, rather than concentrating in a narrow
set of industries.
36Section B – Part 3 Trends in Grant Distribution by Sectors
37Section B – Part 3 Trends in Grant Distribution by Sectors
Equity grants for employees ages 31–40 show a clear shift in where value is being allocated. Fintech takes a larger share in the most recent
period, while the rest of the mix becomes more balanced across sectors. This points to equity being concentrated in roles tied to revenue
growth and operational execution, not just early product development. Business Software’s share has eased compared with earlier years,
and HealthTech and Industrial & Energy account for a smaller portion of grants.
At the same time, Media & Entertainment and the broader Other category remain meaningful, underscoring that equity for this age group is
still widely distributed even as a few sectors gain momentum.
38Section B – Part 3 Trends in Grant Distribution by Sectors
39Section B – Part 3 Trends in Grant Distribution by Sectors
For the 41–50 age group, equity allocation continues to shift toward more scaled sectors over time, with Fintech taking a noticeably larger share
in the most recent period. This aligns with where this cohort typically shows up, in senior operating and execution roles as companies push go-
to-market and revenue maturity. At the same time, HealthTech and Industrial and Energy account for a smaller share than in earlier years, while
Business Software and Cyber remain present but secondary.
The mix stays diversified overall, but the center of gravity is clearly moving toward sectors that value experienced leadership and operational
depth.
40Section B – Part 3 Trends in Grant Distribution by Sectors
41Section B – Part 3 Trends in Grant Distribution by Sectors
For the 51+ age group, equity grants concentrate in more established, capital-intensive sectors. Fintech holds the largest share throughout the
period, with HealthTech and Industrial and Energy also carrying meaningful weight, reflecting where deep domain expertise and operational
experience are most valued.
Over time, the mix becomes less HealthTech-heavy and more diversified, with Other Sectors expanding in the later years. Business Software
and Cyber remain smaller components of the 51+ pool, reinforcing that equity at this stage tends to follow experience, regulation, and execution
depth rather than early product build.
42Section B – Part 4 Exercise to Liquidity
This chart shows the share of total option holders who reached a concluded event, either exercising or canceling, during the observed period.
In other words, it captures how much of the option holders “resolved” their grants, before looking at what the outcomes were. Resolution rates vary
by sector, reflecting differences in grant maturity, liquidity opportunities, and the practical likelihood of taking an action.
43Section B – Part 4 Exercise to Liquidity
Grant outcomes reflect both choice and timing among option holders who reached a concluded event in the prior chart. In other words, these
percentages show how resolved grants break down between exercised, canceled, or mixed outcomes. Exercising is typically an active decision
by the option holder, while cancellations can be driven by circumstances such as leaving a role voluntarily or being terminated. Mixed outcomes
capture cases where some options were exercised, and others were canceled for any of these reasons.
44Section B – Part 4 Exercise to Liquidity
The following chart focuses on employees who exercised and tracks how often those exercises turned into liquidity through a sale. The pattern is
clearly sector-driven. FinTech shows the strongest conversion from exercise to sale, with Business Software also converting at relatively high
rates, reflecting more consistent secondary access and clearer liquidity paths.
HealthTech remains the key outlier, with many exercisers continuing to hold rather than sell, in line with longer timelines and fewer near-term
liquidity windows. Age differences exist, but sector dynamics and secondary market access are the primary drivers of realized value.
45Section B – Part 4 Exercise to Liquidity
46Section B – Part 4 Exercise to Liquidity
This view shows how option outcomes shift year by year across age groups among option holders who reached a concluded event in each
year. In 2022, outcomes leaned more heavily toward cancellations, particularly among younger employees, while older age groups were
more likely to exercise.
Across 2022–2024, mixed outcomes remain a meaningful share for the ≤30 group, consistent with higher job mobility and more cases where
some options are exercised while others are later canceled upon departure.
The 2023 and 2024 period reflects a broader normalization, with exercise becoming more dominant across mid-career and senior groups as
cancellations eased.
In 2025, cancellations rise again across age groups and exercise rates compress. Importantly, cancellations are not always a deliberate
choice and often reflect employees leaving the company, while mixed outcomes capture cases where some options were exercised and the
remainder was later canceled.
47Section B – Part 4 Exercise to Liquidity
48Section B – Part 4 Exercise to Liquidity
This chart tracks how often employees who exercise options actually convert that equity into cash, broken out by age group and year.
The pattern moves in clear cycles. In 2022, sell through rates were relatively high across age groups, consistent with more accessible liquidity
windows.
That momentum faded in 2023 and 2024, when a smaller share of exercised options resulted in liquidity, reflecting tighter access to buyers
and fewer sale opportunities.
In 2025, sell through rebounds across all age bands and becomes more evenly distributed, pointing to a reopening of liquidity channels.
Lower sell through in prior years does not necessarily reflect lack of interest. More often, it reflects timing, company policy, and limited access
to buyers. The recovery in 2025 suggests more structured liquidity programs and clearer paths from exercise to sale.
49Section B – Part 4 Exercise to Liquidity
50Executive Summary: Setting the Stage for 2026
The State of the Market
The private funding market has moved from stagnation to selective momentum, with Q4 2025 establishing a constructive foundation for the year
ahead. While the market is no longer frozen, it remains unforgiving; capital has returned, but investors are exclusively backing companies that
demonstrate durable unit economics and operational discipline.
The Key Trends
The ecosystem is maturing both in how it handles liquidity and talent. Secondary transactions are no longer rare, episodic events but have become
a standard component of the Series B playbook for founders and employees. Simultaneously, equity grants are diversifying beyond core software
into Fintech and other industrial sectors, with allocation increasingly rotating toward senior talent (ages 51+). This shift signals a market that now
prioritizes operational experience and specialized expertise over rapid, early-stage expansion.
The Path Forward
The data reveals a sharp divergence in valuation trends: high-momentum sectors like AI and Cybersecurity are pulling ahead, while others are
being forced to prioritize efficiency-driven growth. Although we forecast a brief reset in Q1 2026, the overall trajectory points toward broader
market activity by Q2. As revenue multiples stabilize and exit timelines shift, the market is moving toward a more mature environment where
companies are priced and built based on their ability to deliver realized value. 51Thank You!
ContactUs@altshare.com
ContactUs@altshare.com
+972 73 20 99999
24,116 Circle X Logo Royalty-Free Photos and Stock Images | Shutterstock
52
About altshare
altshare is a leading, fast-growing Equity Management & Compensation Plans Administration solutions provider. We love challenges. We are obsessed with our clients. We are on a mission to redefine the way founders do equity. All our products & services are supported through the altshare Platform - the only equity management platform built for entrepreneurs.