Switching from Pulley? We’re helping hundreds of companies transition quickly and securely. Talk to our team ❯
Switching from Pulley? We’re helping hundreds of companies transition quickly and securely. Talk to our team ❯
.jpg)


DISCLAIMER
This report is issued by and on behalf of altshare Ltd. ("altshare") for informational purposes only and shall not be constru ed as legal, financial, or tax advice.
The information contained in this report is based on data provided to and/or prepared by altshare for its clients. The report is based on an aggregated and anonymized data from altshare's clients.
While this report may address potential legal, financial, and/or tax matters, it does not constitute professional advice in t hese areas. The opinions or conclusions expressed herein are not to be attributed to altshare. We strongly recommend that you seek the counsel of qualifi ed advisors before taking any actions based on the information provided in this report.
For the avoidance of doubt, altshare shall not assume any liability for, nor be held responsible for any damages, losses, cla ims, or expenses, whether direct, indirect, incidental, consequential, special, or punitive, arising from the use or reliance on the information contained in this report.
altshare shall not be liable for any actions taken or not taken based on the information contained herein.
altshare does not warrant the accuracy, completeness, or reliability of the data presented and assumes no responsibility for any errors or omissions.
The information provided in this report is subject to change without notice.
This report is provided "as is" and altshare disclaims any responsibility for the outcomes of decisions made by the recipient or any third party in reliance on its contents.
Equity Fundraising, Valuations & Grants Overview | Powered by altshare's Equity Management Intelligence platform
• Equity Fundraising and Valuations Across Sectors
• The State of SAFE Rounds
• Founder Team Structure and Cap-Table Dilution
• Revenue Multiples by Sector
• Grants: Gender & Age Distribution
Appendix A Sector Drill-Down: Equity Fundraising & Valuations
Appendix B Grants Drill-Down: Gender & Age by Sector
• After the Q1 pause, the market found its floor – Seed and Series A steadied even as pre-money eased ~8% and ~13% year over year. This is discipline, not retreat.
• Capital is concentrating in conviction: AI and Cyber command the largest Series A checks ($19.7M and $14.7M) and the steepest valuation premiums in the market.
• Cyber's resilience stands out – deal sizes cooled ~26% from their peak, yet its valuation premium held firm: smaller checks, still a premium price.
• Founders are raising earlier and smarter – a record $1.9M pre-seed SAFE funds real progress before a priced round, reshaping the cap table along the way.
• Valuations are priced with precision: revenue multiples compressed across every sector, with Cyber converging on AI at 4.8x.
• Teams are leaner and the talent mix is shifting – solo founders have nearly doubled since 2021, while equity grants skew male and toward experienced hires.
• Equity grants still skew male — about two-thirds to one-third (65% / 35%) overall — yet the gap narrows sharply by generation, with under-30s near parity (~52% / 48%).
Q2 2026 is the quarter the private market stopped falling and started choosing. The headline numbers are calmer – deal sizes stabilized and valuations eased only modestly – but beneath the surface the market is sorting hard.
Capital is flowing back, yet it pools around a narrow set of defensible, high-conviction companies in AI and cybersecurity, while the long tail competes for thinner rounds at tighter prices.
With the cost of capital no longer falling, investors have stopped re-rating entry valuations and instead reward execution, efficiency, and proof. On the talent side, equity grants still skew male (about 65% / 35%), though under-30s sit near parity — a gap that reads as generational, not structural.
This report unpacks how that selectivity plays out at every level: where capital concentrates across sectors and stages, why the AI and Cyber valuation premiums persist, how founders use SAFEs to raise earlier and where dilution really bites, how revenue multiples are compressing, and how equity grants are shifting by gender and age. Appendix A drills into each sector round by round, and Appendix B breaks the grants picture down by sector – turning this quarter's signal, selectivity over exuberance, into a sector-by-sector playbook.
In a market that rewards conviction over capital, the edge increasingly goes to teams with real-time intelligence over their own equity, not just access to capital.
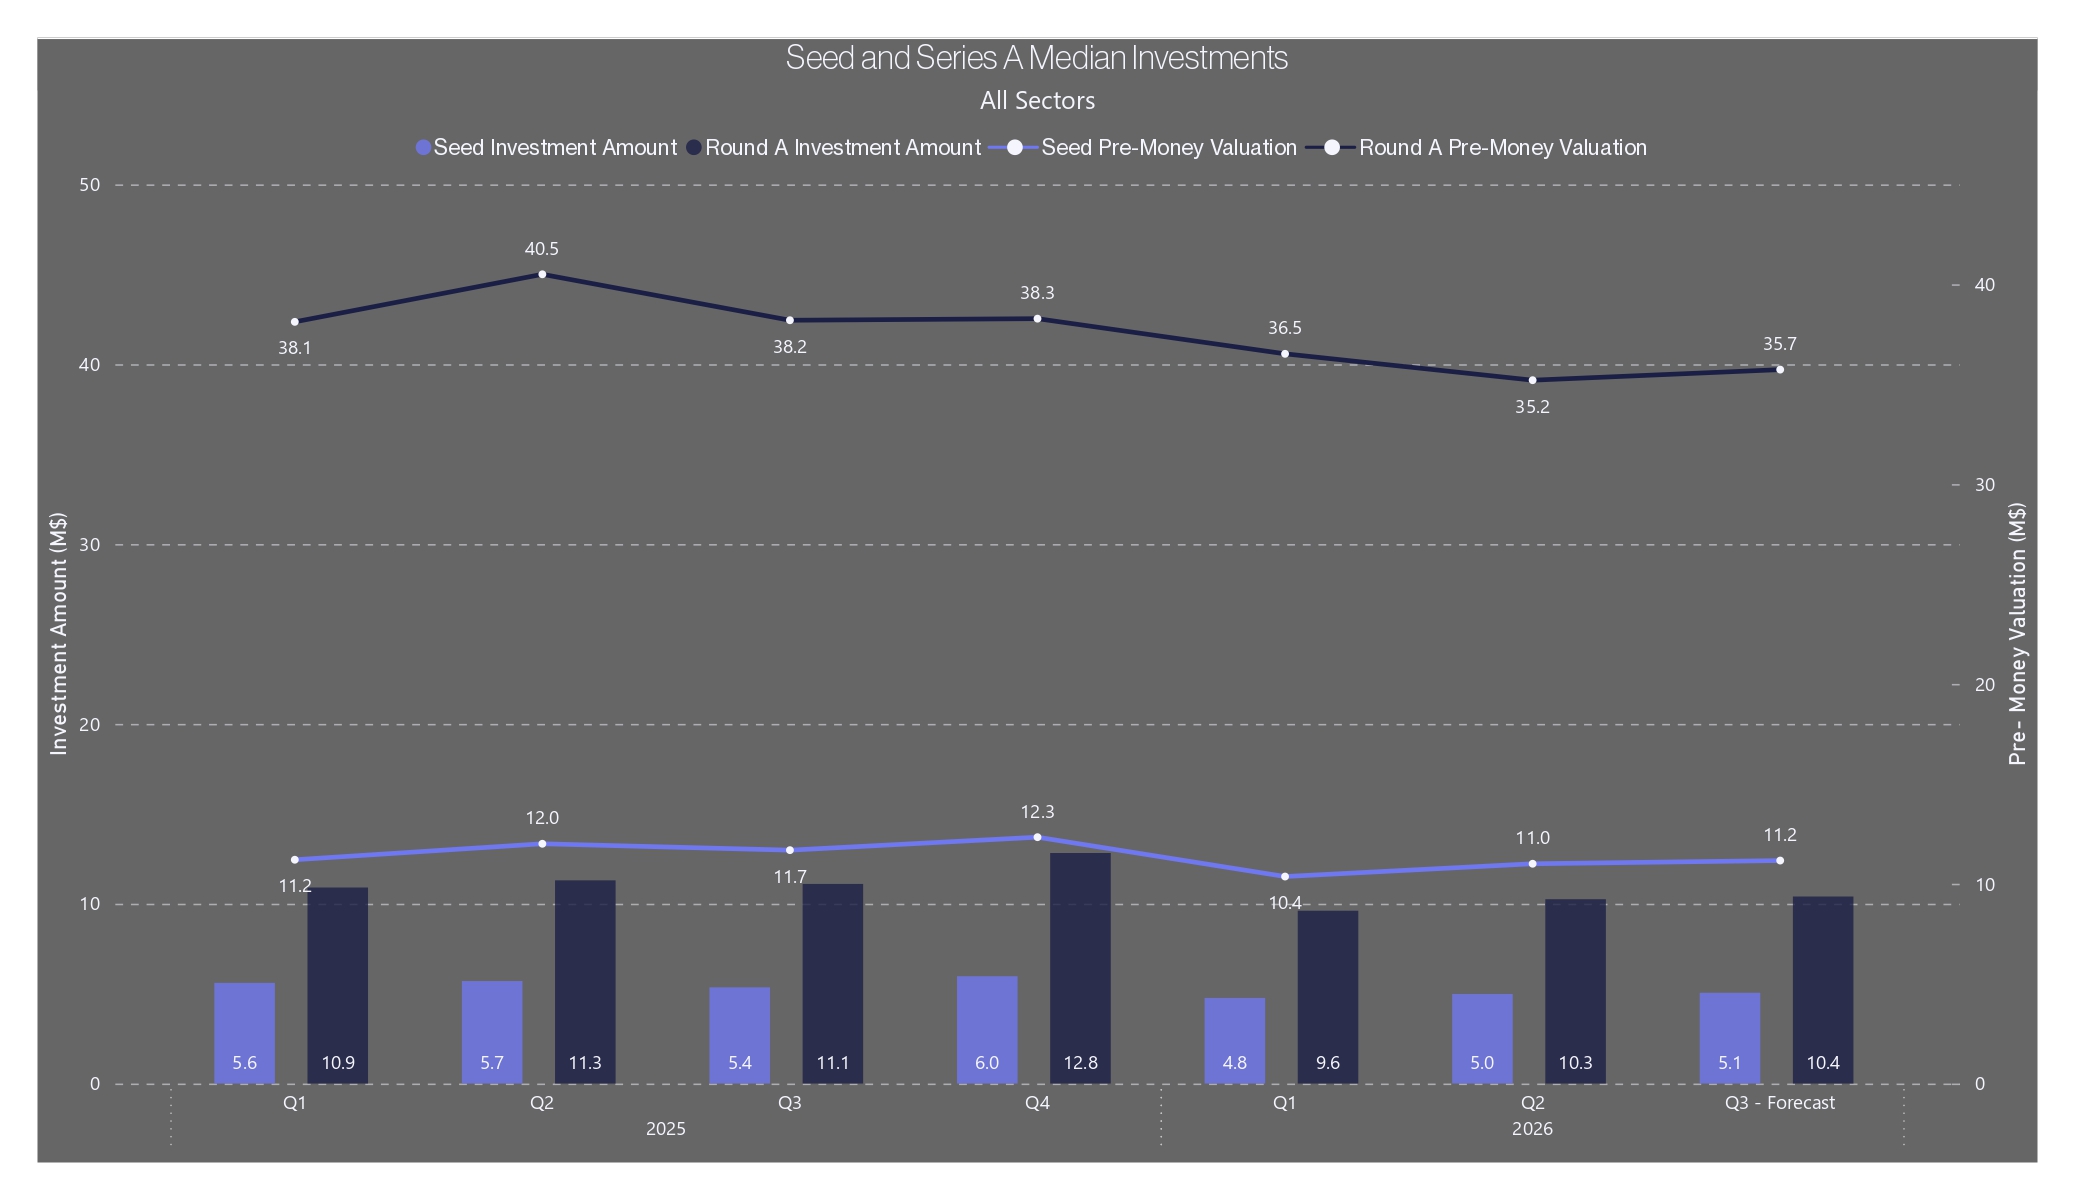
EQUITY RE -RATED LOWER YOY – SEED -8% AND SERIES A -13% VS Q2 2025 – BUT BOTH STAGES STABILIZED AFTER THE Q1 PAUSE.
Compared with a year ago, equity rounds have stepped down across the board. Versus Q2 2025, all-sector Seed pre-money is down about 8% ($12.0M – $11.0M) and Series A pre-money about 13% ($40.5M – $35.2M), while median deal sizes fell roughly 13% at Seed ($5.7M – $5.0M) and 9% at Series A ($11.3M – $10.3M).
But this quarter also marks a turn. After the Q1 2026 pause, both stages stabilized off their lows, and our Q3 forecast ($5.1M / $11.2M at Seed; $10.4M / $35.7M at Series A) points to a market that is steady in volume but increasingly selective on price.
Sector-by-sector drill-down: see Appendix A.
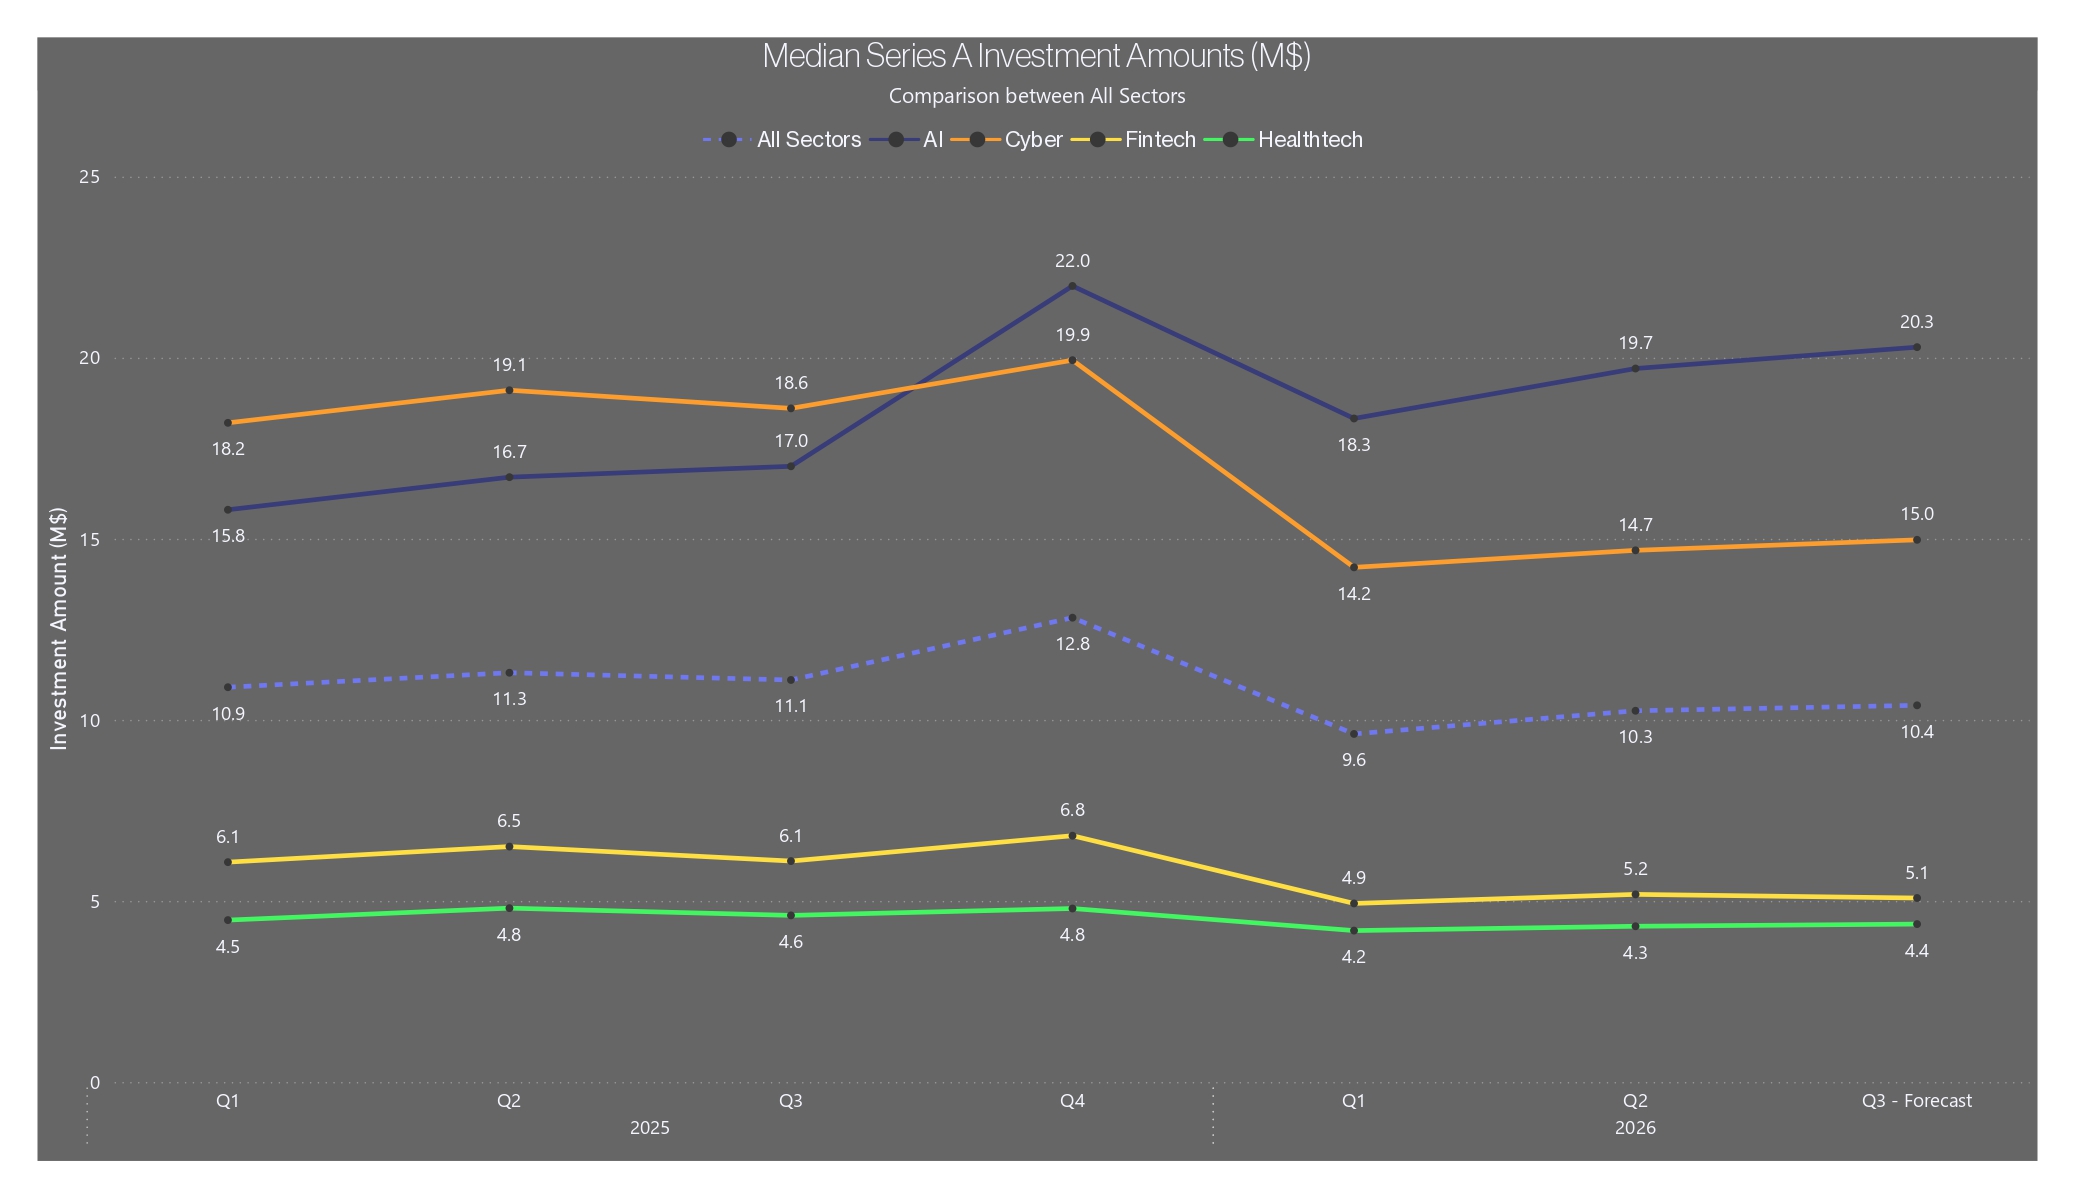
SERIES A CAPITAL CONCENTRATES IN AI AND CYBER, YET CYBER'S MEDIAN CHECK HAS PULLED BACK ~26% FROM ITS 2025 PEAK.
AI and Cyber still command the largest Series A checks in Q2 2026 – $19.7M and $14.7M – far ahead of Fintech ($5.2M) and HealthTech ($4.3M). This view measures deal size: the median amount raised per round, not valuation. The spread underscores a widening divide, with capital concentrating in defensible, high-conviction sectors.
The notable move at the top is Cyber's pullback: its median Series
A check has eased from a 2025 range of roughly $19–20M to $14.7M – down about 26% from the Q4 2025 peak – even as it stays a top-funded sector. The next two slides shift the lens from how much sectors raise to how they are priced – opening with Cyber's pre-money valuation premium, then AI's.
Sector-by-sector drill-down: see Appendix A.
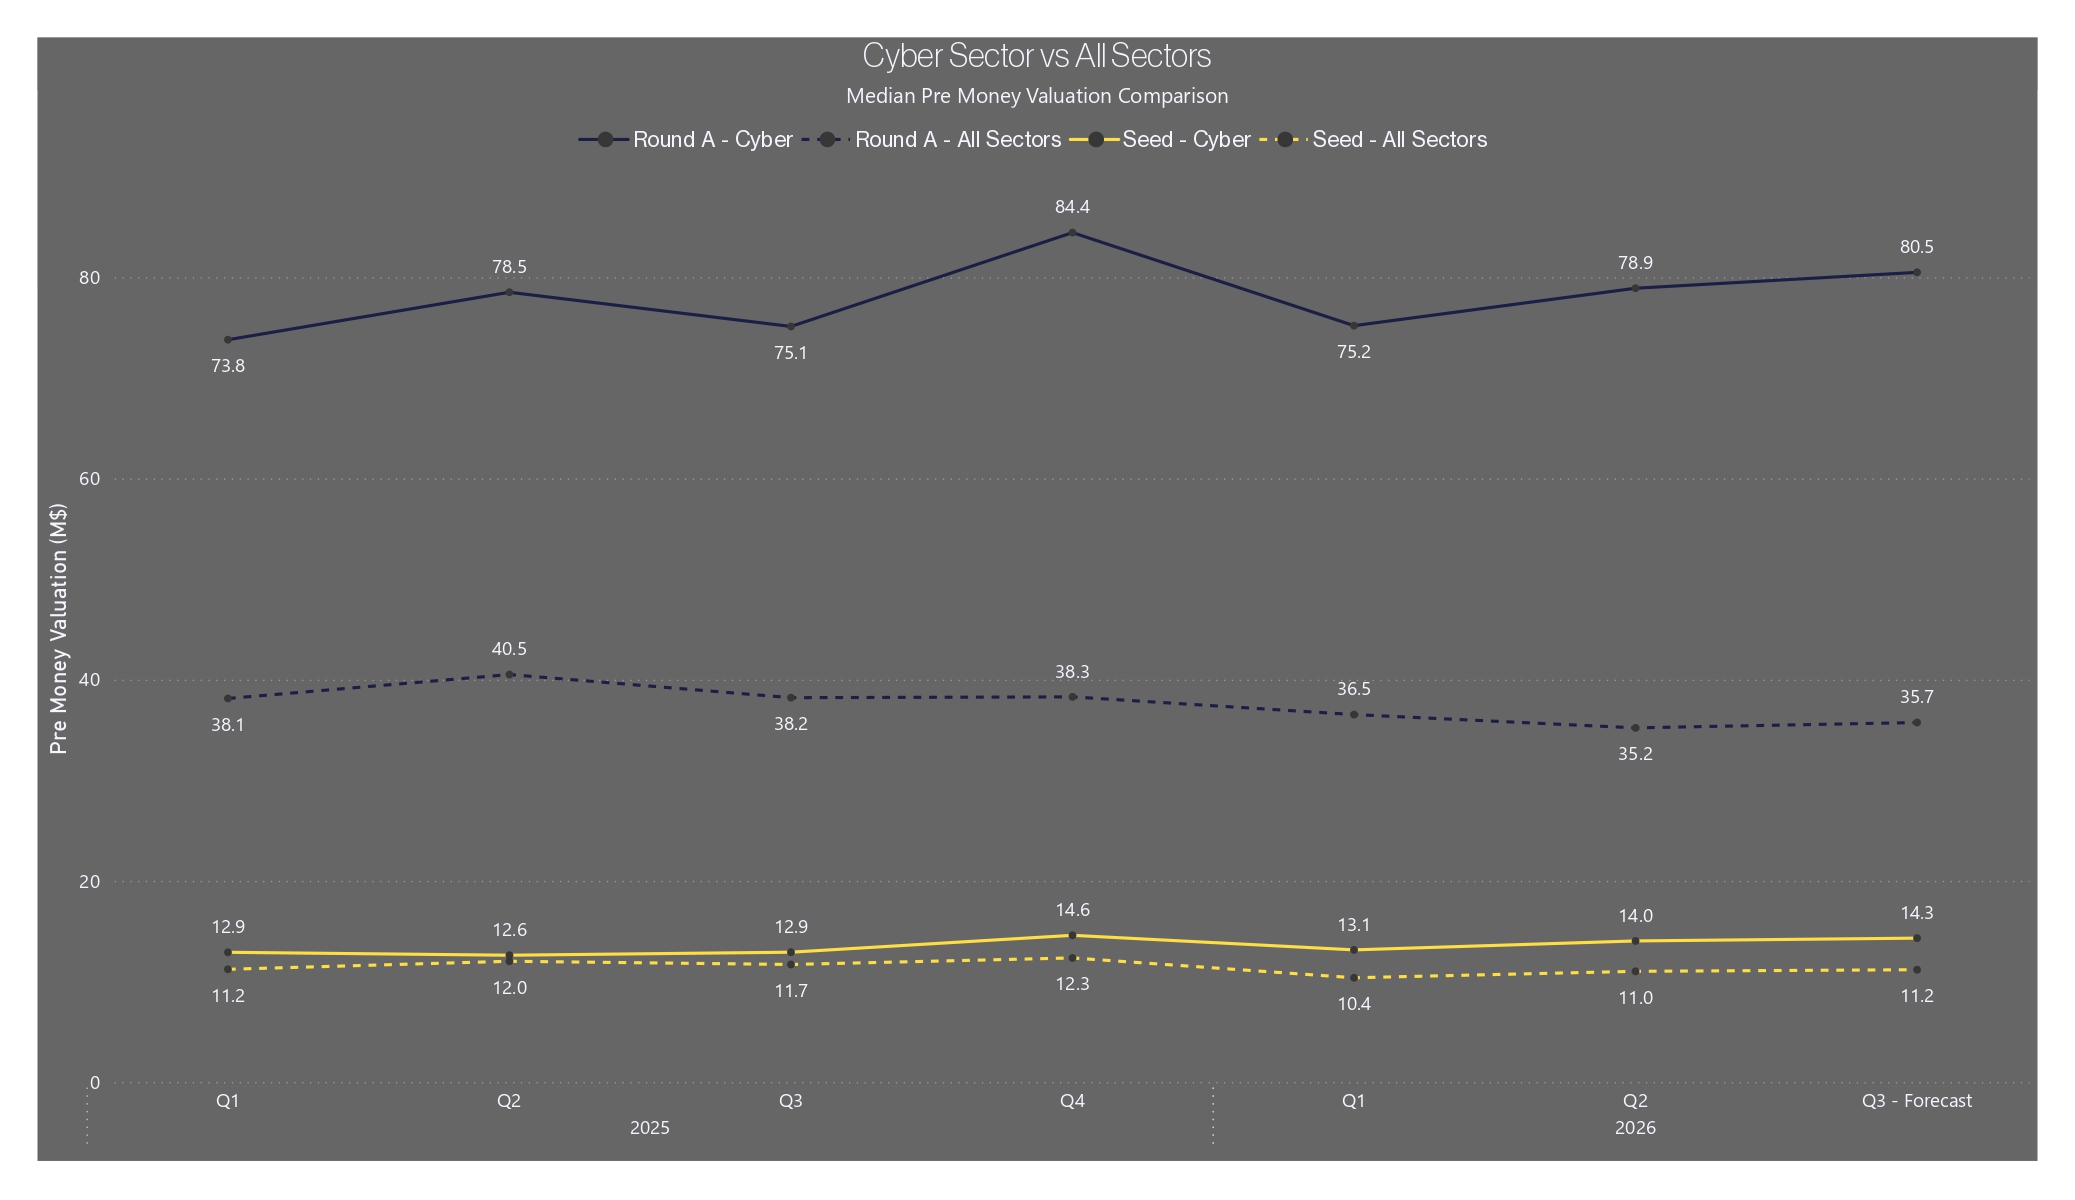
CYBER HOLDS THE STEEPEST VALUATION PREMIUM – ~2.2X VS THE ALL -SECTOR SERIES A MEDIAN – EVEN AS DEAL SIZES EASE.
The lens now shifts from how much sectors raise to how they are valued – pre-money, the price set before new money goes in. On this measure Cybersecurity carries the steepest premium: in Q2 2026 Cyber Series A pre-money ($78.9M) ran about 2.2x the all-sector median ($35.2M), the widest gap of any sector.
At Seed it is narrower – Cyber ($14.0M) sits ~27% above the all-sector $11.0M.
The premium is demand-driven, not hype: persistent, threat-led enterprise spending sustains rich valuations even as all-sector prices drift lower, and the gap has held across 2025–2026.
The contrast with the prior slide is the key point – Cyber's median check has eased, yet its pre-money premium holds: smaller checks, still a premium price.
Sector-by-sector drill-down: see Appendix A.
AI'S PRE -MONEY PREMIUM IS WIDE AND DURABLE – ABOUT 40% ABOVE MARKET AT SEED AND 54% AT SERIES A.
Like Cyber, AI's edge shows up in valuation, not just deal size: its pre-money premium over the broader market stays wide at both stages. In Q2 2026, AI Seed pre-money ($15.4M) sat roughly 40% above the all-sector median ($11.0M).
At Series A the gap is wider still – AI pre-money ($54.2M) ran about 54% above the all-sector A median ($35.2M). Even as all-sector valuations drift lower, the AI premium has proven durable.
Sector-by-sector drill-down: see Appendix A.
FOUNDERS RAISE EARLIER – SAFE PRE -SEED HIT A RECORD $1.9M – TO FUND PROGRESS BEFORE PRICING A ROUND, BUT THOSSTACKED SAFES ARE EXACTLY WHAT SET UP THE SHARP DILUTION AT SEED (NEXT SLIDE).
Median SAFE round sizes kept climbing in Q2 2026: pre-seed rose to $1.9M – the highest in the dataset – up from $1.7M in Q1, while Seed held around $3.0M.
The pull toward pre-seed is deliberate. A SAFE lets founders raise without fixing a valuation, so they sidestep the price negotiation that a priced round forces in today's more selective market – and keep moving. Companies increasingly open with a larger pre-seed to fund real progress and hit milestones before sitting down to argue valuation at Seed. The step-up from pre-seed to Seed has compressed further, from roughly 1.7x to 1.6x, as pre-seed checks grow faster than Seed.
It's exactly the kind of compounding, easy-to-miss dilution that real-time cap table modeling is built to catch before it costs you equity.
BECAUSE THE PRE -SEED SAFES FROM THE PRIOR SLIDE ALL CONVERT AT SEED, THE SHARPEST DILUTION LANDS EARLY — FOUNDERS DROP FROM 88% TO 50% AT THE PRE -SEED -TO -SEED STEP.
Each round reshapes the cap table, but the single biggest hit lands early: founders fall from a median 88.4% at pre-seed to 50.2% at Seed – a near 38-point drop in one step – before ownership declines more gradually to 39.8% at Series A, 30.1% at B, and 24.1% at C.
Why so sharp? Seed is typically the first priced round, and it is where the accumulated pre-seed SAFEs all come due: every SAFE raised up to that point converts into preferred shares at once, and the option pool is created or topped up at the same time (from 5.4% to 9.8%). That combined conversion-plus-pool event concentrates the dilution into the pre-seed-to-Seed transition – which is exactly why the earliest terms matter most.
TEAMS ARE GETTING LEANER – SOLO FOUNDERS ROSE FROM ~ 12 % (2021) TO ~ 25% (2025); TWO - FOUNDER TEAMS STAY DOMINANT.
Two-founder teams remain the dominant startup structure across every cohort (around 41–46%), but the share of solo founders has climbed steadily – from about 12% of companies founded in 2021 to roughly 25% of those founded in 2025. The shift is consistent with an AI-era in which leaner teams can build and ship more with less.
Larger teams have thinned correspondingly: three-founder teams eased from about 30% to 22%, and four-plus from roughly 12% to under 10% in the newest cohorts. Importantly, leaner teams describe how companies are built, not how much they raise – founders are forming smaller teams even as round sizes hold at or above prior levels, a shift toward capital efficiency rather than smaller ambitions.
MULTIPLES COMPRESSED ACROSS EVERY SECTOR, WITH CYBER EASING SMOOTHLY TO 4.8X – NOW AT PARITY WITH AI.
Revenue multiples used in comparable-company valuations compressed across every sector into 2026 H1 – a broad repricing toward discipline rather than exuberance. AI eased to 4.8x (from 5.4x), FinTech to 3.9x (from 4.2x), and HealthTech to 3.3x (from 3.7x).
Cybersecurity stands out for the smoothness of its path. Rather than a sharp correction, its multiple has drifted down gently and steadily to 4.8x, now at full parity with AI at the top of the hierarchy.
That gradual, low-volatility decline mirrors cyber's demand profile – steady, threat-led enterprise budgets that hold pricing firm even as the broader market re-rates lower.
A reminder that in this market, the edge goes to teams pricing scenarios with data, not instinct.
EQUITY GRANTS SKEW ABOUT TWO -THIRDS MALE OVERALL (65% / 35%), BUT THE BALANCE VARIES WIDELY BY SECTOR.
Across all sectors, equity grants split roughly two-thirds male to one-third female over 2022–2026 (65.3% / 34.7%) – but the balance varies widely by sector, tracking each field's underlying workforce rather than any single market-wide effect.
Health Tech & Life Sciences (42.2% female) and Agriculture & Food (41.9%) come closest to parity, reflecting deeper female representation in life-science and bio disciplines. Cyber Security (26.1%), Business Software (26.8%), and Industrial & Energy
(27.4%) remain the most male-weighted – engineering- and hardware-heavy fields where the technical talent pool itself skews male, so grants, which follow headcount, inherit that imbalance.
THE GENDER GAP WIDENS WITH SENIORITY – UNDER - 30S NEAR PARITY (~52/48), THE 51+ GROUP MOST MALE -WEIGHTED.
Breaking grants down by age reveals a clear pattern: younger cohorts are far more balanced – under-30s sit near parity at about 52% / 48% – and the gap widens steadily with seniority, peaking in the male-heavy 51+ group. Health Tech and Agri & Food stay the most balanced at every age, while Cyber, Business Software, and Industrial & Energy remain male-heavy throughout.
This raises a question: is the gap narrowing generationally? The near-even split among under-30s suggests the newest cohorts entering tech are far more balanced than the senior ranks built over earlier decades. Part of the overall imbalance may therefore be a legacy effect that fades as these younger, more balanced cohorts advance – rather than a fixed structural feature of the industry. Per-sector breakdown: see Appendix B.
GRANTS ARE SHIFTING TOWARD EXPERIENCED TALENT – THE UNDER -30 SHARE FELL FROM ~8% (2023) TO ~3% (2026).
The age mix of grant recipients has moved steadily older: across all sectors the under-30 share has compressed from roughly 8% in 2023 to about 3% in 2026, while the 51+ group expanded from around 26% to 35%. Mid-career employees (31–50) still receive most equity. Is this a structural shift in the tech labor market? Junior hiring has slowed sharply since 2022, and one plausible driver is the wave of layoffs at large companies – with so many experienced engineers suddenly available, employers may be filling roles with seniors who once would have gone to juniors, leaving fewer entry-level hires to grant equity to.
The direction is well supported, though the magnitude is likely amplified by a half-year read that captures more senior-skewed refresh and promotion grants.
The open question is how much of the shift is selectivity and retention versus a lasting reset of who gets hired at all.
Per-sector breakdown: see Appendix B.
A round-by-round, sector-by-sector view behind the Part 1 charts – median investment and pre-money valuations at Seed and Series A, for All Sectors, AI,
Cybersecurity, HealthTech, and FinTech, quarter by quarter through the Q3 2026 forecast.
ALL - SECTOR SEED STEADIED AT $5.0M / $11.0M – RECOVERING OFF THE Q1 LOWS, A PAUSE RATHER THAN A TREND.
Seed medians steadied in Q2 2026, with median investment at $5.0M and pre-money valuation at $11.0M – recovering modestly from the Q1 2026 pause of $4.8M and $10.4M. The rebound confirms the quarter’s softness was a pause rather than a trend, even as both metrics remain below the Q4 2025 highs of $6.0M and $12.3M.
Our model projects continued stabilization in Q3 2026, at $5.1M and $11.2M. With foreign investors still supplying roughly two-thirds of early-stage capital, the pace of any broader recovery hinges on sustained cross-border participation as much as on domestic conditions.
AI SEED REBOUNDED TO $5.1 M / $15.4M, STAYING CLEAR OF EVERY OTHER SECTOR AT SEED.
AI Seed medians rebounded in Q2 2026 to $5.1M in median investment and $15.4M in pre-money valuation, up from the Q1 dip of $4.9M and $13.8M.
The recovery keeps AI clear of every other sector at Seed, though still below the Q4 2025 peak of $6.5M and $16.4M.
Our model projects a further uptick in Q3 2026 to $5.3M and $15.9M. Appetite for top-tier AI teams stays strong, but the premium is increasingly earned through execution and traction rather than narrative – a discipline that has only sharpened as the cycle matures.
CYBER SEED FIRMED TO $6.3M / $14.0M – THE HIGHEST - FUNDED SEED SECTOR AFTER AI.
Cyber Seed activity firmed in Q2 2026 to $6.3M in median investment and $14.0M in pre-money valuation, recovering from $6.1M and $13.1M in Q1.
Cyber remains the highest-funded Seed sector after AI, reflecting sustained enterprise demand and an expanding threat surface.
Our model forecasts Q3 2026 at $6.4M and $14.3M. The renewed conflict with Iran reinforces the case further – and in Israel much of the AI premium in fact flows through cybersecurity, keeping the sector structurally well-bid even as the broader market turns selective.
HEALTHTECH SEED HELD STEADY AT $ 3.1 M / $ 7.6M – SMALL BUT RELIABLY STABLE.
HealthTech Seed held steady in Q2 2026 at $3.1M in median investment and $7.6M in pre-money valuation, a modest step up from $3.0M and $7.4M in Q1. The sector remains the smallest by median round size, reflecting longer development timelines and narrower investor pools at the earliest stage.
Our model projects a flat-to-modest Q3 2026 at $3.1M and $7.7M. With broader life-sciences funding under visible pressure, capital is increasingly reserved for teams that can show efficiency and a clear regulatory path rather than early-stage promise alone.
FINTECH SEED STABILIZED AT $3.9M / $11.7M BUT STAYS THE WEAKEST SEED SECTOR.
Fintech Seed medians stabilized in Q2 2026 at $3.9M in median investment and $11.7M in pre-money valuation, edging up from the dataset lows of $3.8M and $11.2M in Q1. Even with the modest tick higher, Fintech remains the weakest Seed sector as investor focus stays rotated toward AI and defense-adjacent themes.
Our model projects a flat Q3 2026 at $3.9M and $11.7M. With the market now pricing little further rate relief in 2026, a recovery likely depends on a standout, software-first category emerging rather than on a cheaper cost of capital.
ALL -SECTOR SERIES A STEADIED AT $ 10.3M / $ 35.2M – ROUND SIZES FIRMING, VALUATIONS STILL EASING.
Series A medians steadied in Q2 2026, with median investment at $10.3M and pre-money valuation at $35.2M – a modest recovery in deal size from $9.6M in Q1, even as pre-money continued to ease from $36.5M. The pattern shows round sizes stabilizing while valuations stay under pressure.
Our model projects Q3 2026 at $10.4M and $35.7M. The bar to graduate from Seed to Series A keeps rising – time-to-A has stretched and first-time financings are scarce – so companies increasingly need to travel further operationally before a round clears.
AI SERIES A REBOUNDED TO $19.7M / $54.2M – THE Q1 PULLBACK WAS NORMALIZATION, NOT REVERSAL.
Series A AI rebounded in Q2 2026, with median investment at $19.7M and pre-money at $54.2M – recovering strongly from the Q1 correction of $18.3M and $48.4M, though still shy of the Q4 2025 record of $22.0M and $58.3M. The bounce confirms the Q1 pullback was normalization, not reversal.
Our model projects continued strength in Q3 2026 at $20.3M and $55.9M, with a wide confidence range reflecting high dispersion.
Even so, Israeli early-stage valuations remain well below US benchmarks – a gap that has widened, not closed – leaving room to run for teams with proven product-market fit.
CYBER SERIES A FIRMED TO $ 14.7 M / $ 78.9M – THE HIGHEST PRE -MONEY OF ANY SECTOR.
Series A Cyber firmed in Q2 2026 to $14.7M in median investment and $78.9M in pre-money – up from $14.2M and $75.2M in Q1, though still below the Q4 2025 highs of $19.9M and $84.4M. Pre-money valuations remain the highest of any sector at Series A, signaling that investors are not discounting the companies that clear the bar.
Our model projects Q3 2026 at $15.0M and $80.5M. With state-level threats intensifying amid the Iran conflict, enterprise security budgets keep expanding – yet investors are paying premium valuations while writing disciplined check sizes, a hallmark of the current cycle.
HEALTHTECH SERIES A STAYED MOST RESILIENT AT $4.3M / $21.6M – LOW VOLATILITY, STEADY.
Series A HealthTech remained the most resilient sector in Q2 2026, with median investment at $4.3M and pre-money at $21.6M – a steady step up from Q1’s $4.2M and $20.1M. The narrow range of movement is characteristic of a sector where deal timing tracks clinical and regulatory milestones, not market cycles.
Our model projects Q3 2026 at $4.4M and $21.9M, close to recent averages. Against a backdrop of softer life-sciences funding, this stability stands out – HealthTech remains a low-volatility allocation, even if rarely a high-growth one.
FINTECH SERIES A STABILIZED AT $ BUT STAYS WELL BELOW 5.2M / $ 30.9M 2025 AVERAGES.
Series A Fintech stabilized in Q2 2026 at $5.2M in median investment and $30.9M in pre-money valuation, recovering from the dataset low of $4.9M and $28.7M in Q1. While the uptick is encouraging, valuations remain well below the 2025 average of ~$34.7M, and the sector continues to face a prolonged
fundraising headwind.
Our model projects a roughly flat Q3 2026 at $5.1M and $31.0M – stabilization, not inflection. With rate cuts largely priced out of 2026, capital is migrating toward asset-light, infrastructure-style fintech, leaving capital-intensive models constrained until they prove efficiency.
The per-sector detail behind the Part 5 charts – the gender split by sector and age group, and the full age distribution across every sector (All Sectors, AI & Software, Cybersecurity, FinTech, Health Tech & Life Sciences, Industrial & Energy, Agriculture & Food, and Media & Entertainment) over 2022–2026.
THE PATTERN HOLDS ACROSS SECTORS – YOUNGER COHORTS NEAR PARITY, THE GAP WIDENING WITH SENIORITY.
Breaking the same grants down by age group reveals a consistent pattern: younger cohorts are far more balanced, and the gap widens with experience. Among under-30s several sectors approach parity, whereas the 51+ group is the most male-weighted across nearly every sector.
Health Tech and Agri & Food stay the most balanced at every age, while Cyber, Business Software, and Industrial & Energy remain male-heavy throughout.
The data points to tenure and seniority – not sector cycles – as the primary driver of the imbalance.
THE SHIFT TO OLDER RECIPIENTS IS BROAD-BASED – THE UNDER 30 SHARE FELL ACROSS NEARLY EVERY SECTOR.
The age mix of grant recipients has moved steadily older. Across all sectors, the share going to under-30s has compressed from roughly 8% in 2023 to about 3% in 2026, while the 51+ group has expanded from around 26% to 35%. Mid-career employees (31–50) continue to receive the majority of equity.
The direction is well supported: junior hiring across tech has slowed sharply since 2022, while tenures lengthen and companies concentrate equity on experienced, core-function talent. The magnitude, however, likely overstates a purely demographic shift – a half-year read captures more of the annual refresh and promotion grants that skew senior, alongside a mix weighted toward later-stage companies and older sectors. The signal is selectivity and retention, not workforce automation.
About altshare
altshare is a leading, fast-growing Equity Management & Compensation Plans Administration solutions provider. We love challenges. We are obsessed with our clients. We are on a mission to redefine the way founders do equity. All our products & services are supported through the altshare Platform - the only equity management platform built for entrepreneurs.