


This report is issued by and on behalf of altshare Ltd. ("altshare") for informational purposes only and shall not be construed as legal, financial, or tax advice.
The information contained in this report is based on data provided to and/or prepared by altshare for its clients. The report is based on an aggregated and anonymized data from altshare's clients.
While this report may address potential legal, financial, and/or tax matters, it does not constitute professional advice in these areas. The opinions or conclusions expressed herein are not to be attributed to altshare. We strongly recommend that you seek the counsel of qualified advisors before taking any actions based on the information provided in this report.
For the avoidance of doubt, altshare shall not assume any liability for, nor be held responsible for any damages, losses, claims, or expenses, whether direct, indirect, incidental, consequential, special, or punitive, arising from the use or reliance on the information contained in this report. altshare shall not be liable for any actions taken or not taken based on the information contained herein.
altshare does not warrant the accuracy, completeness, or reliability of the data presented and assumes no responsibility for any errors or omissions. The information provided in this report is subject to change without notice.
This report is provided "as is" and altshare disclaims any responsibility for the outcomes of decisions made by the recipient or any third party in reliance on its contents.
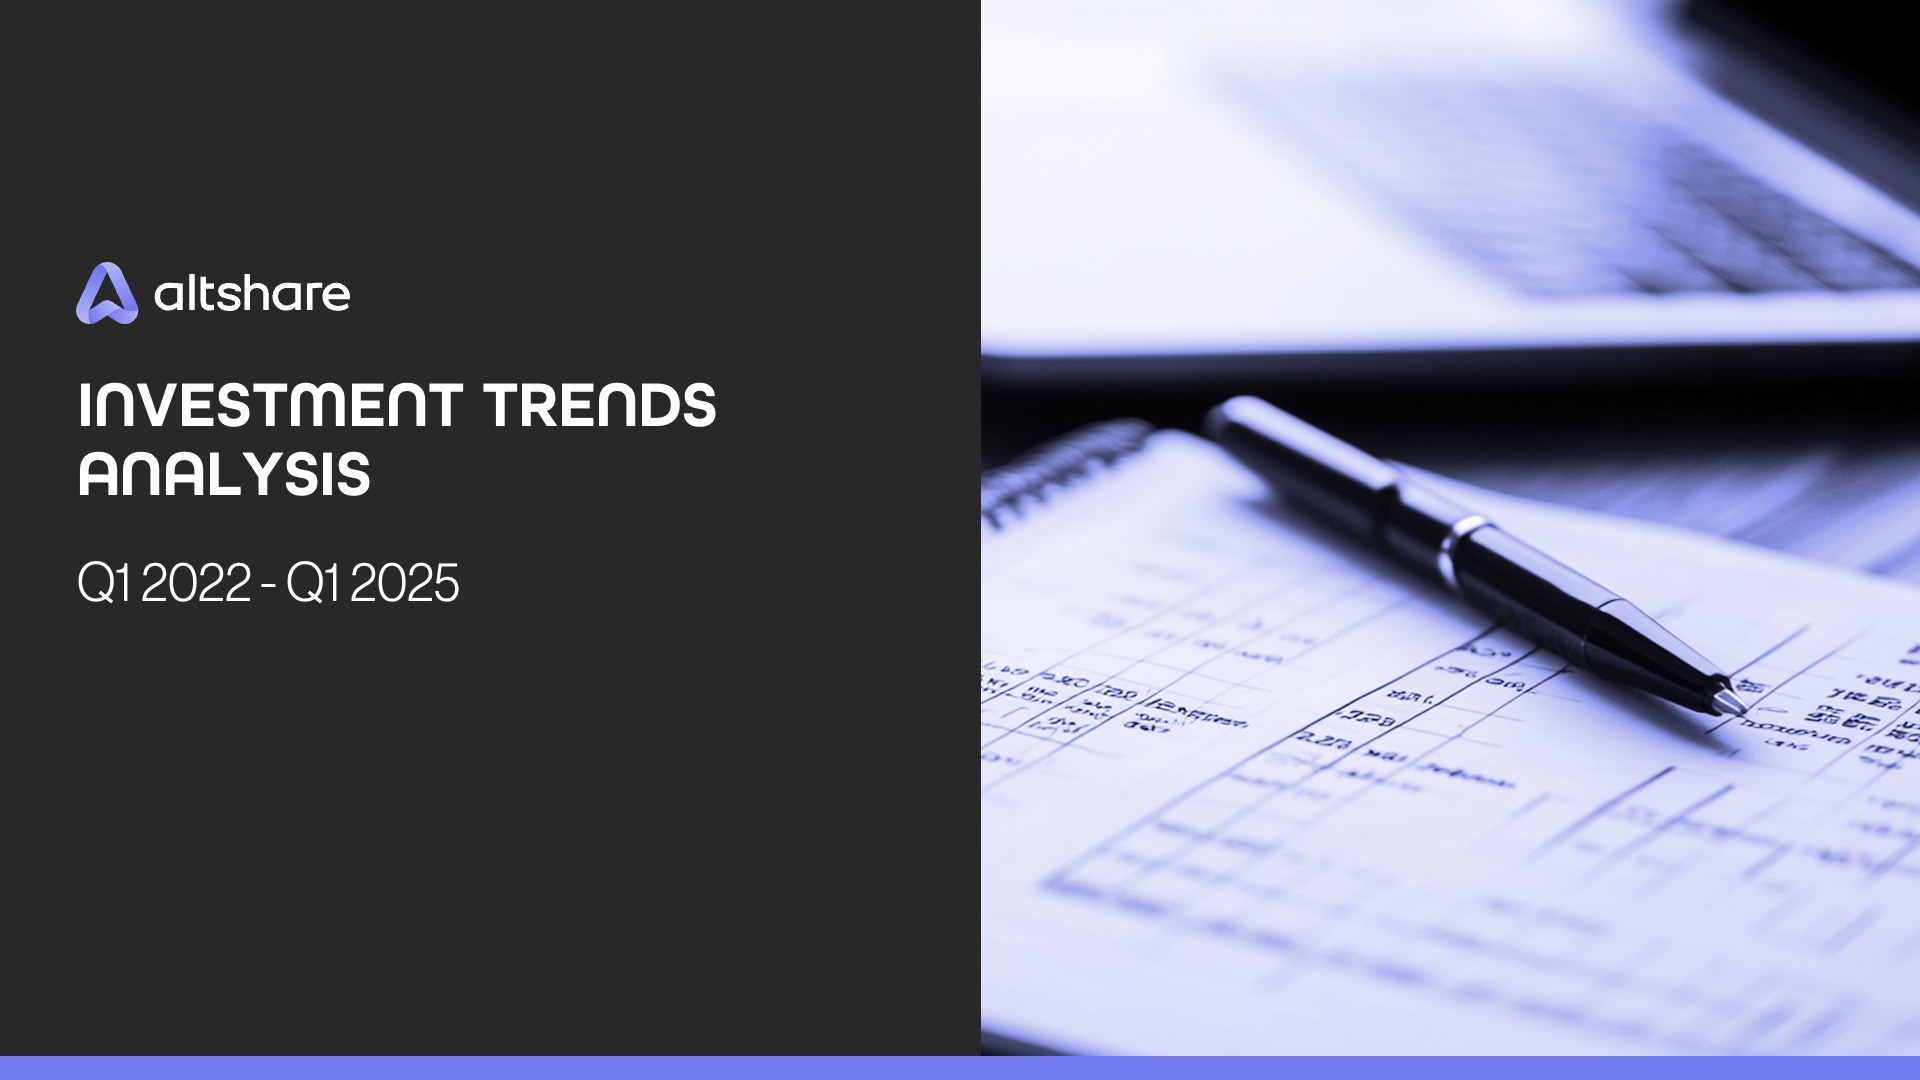
Seed: Recovery with Strings Attached
In early 2025, the Seed stage is adjusting cautiously instead of gaining new momentum. Metrics are better than in 2024, but forecasts show flat valuations and modest funding growth. This shift is happening due to economic and geopolitical issues in Israel, like regulatory uncertainty and currency weakness. Capital is returning, but with stricter conditions. This means investor confidence is improving, but they're still cautious about taking risks.
AI Seed: Still strong but settling.
In Q1 2025, funding and valuations in the AI Seed market stayed steady but began to slow down a bit. While the numbers are still better than last year, the growth is leveling off. Predictions suggest things will remain stable rather than speed up, and the gap between AI Seed and the general Seed market is narrowing. There's still capital available, but founders are facing a more cautious, realistic landscape.
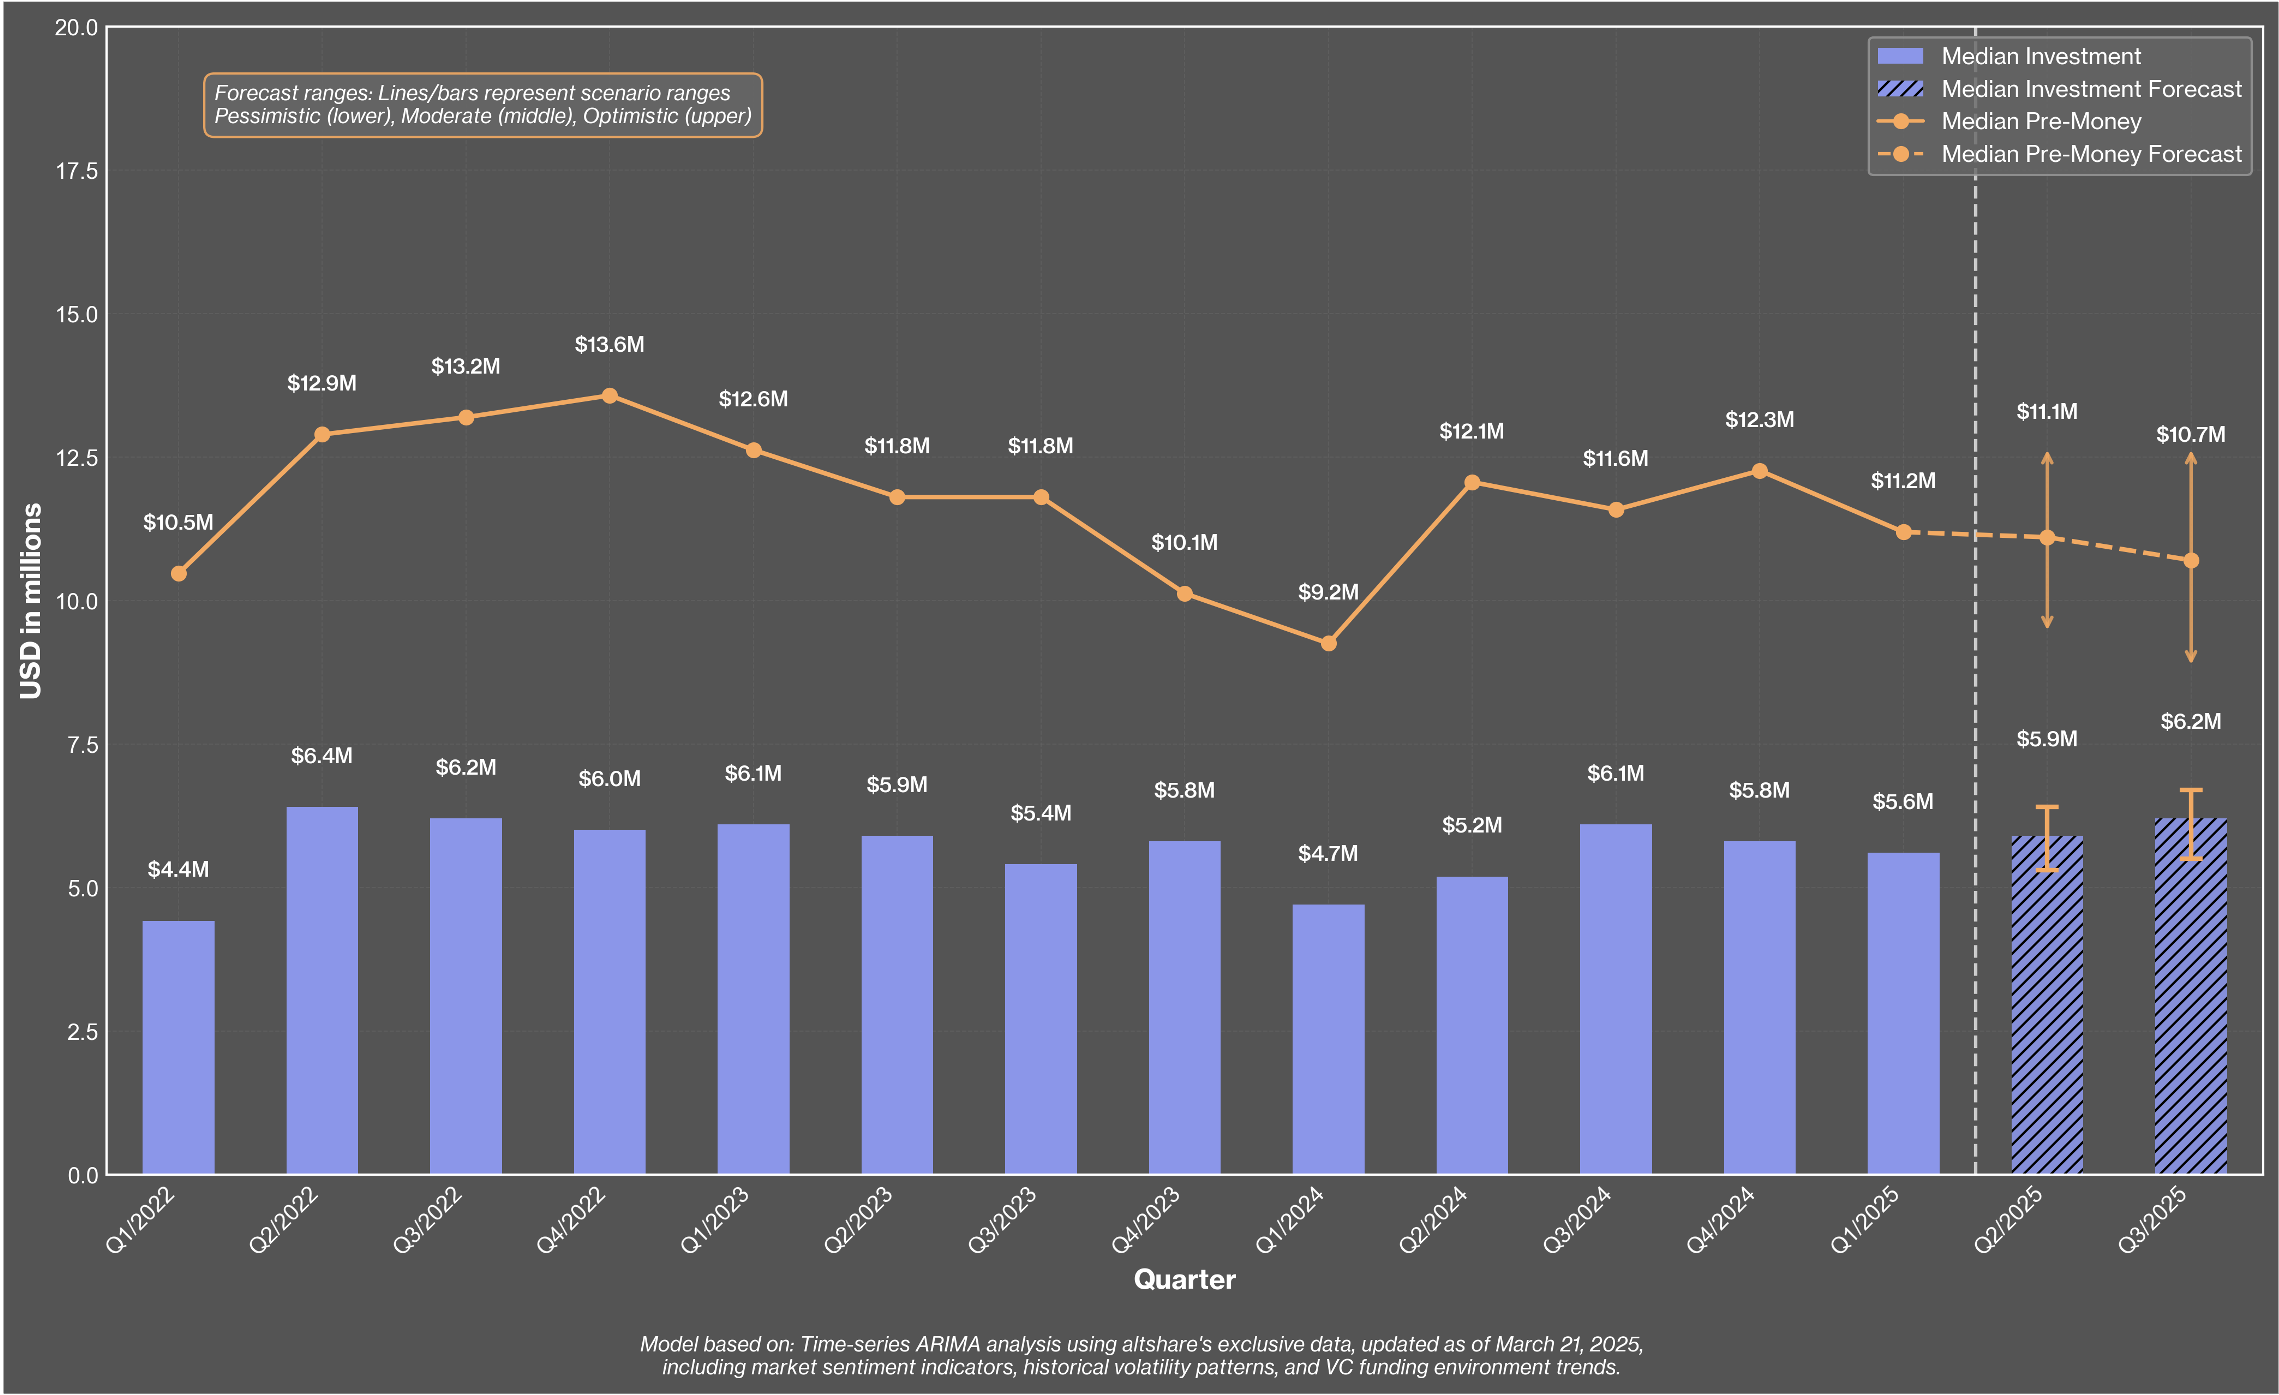
Series A Capital Is There - If You Can Prove Your Worth
In early 2025, Series A metrics show stability but not much growth. Investment volume is slightly down, while valuations are steady. Compared to early 2024, both are still stronger, but growth has slowed since the spike in Q3 2024. The forecasts indicate small gains ahead rather than major breakthroughs. Capital is available, but it's now more linked to actual performance than just potential.
AI Series A is no longer overpriced
After facing heavy corrections in 2022-2023, AI startups are bouncing back. In the first quarter of 2025, they managed to raise more funds at higher valuations than the overall market. Looking ahead to Q2 and Q3, things seem stable, with investors leaning towards established, scalable AI companies.
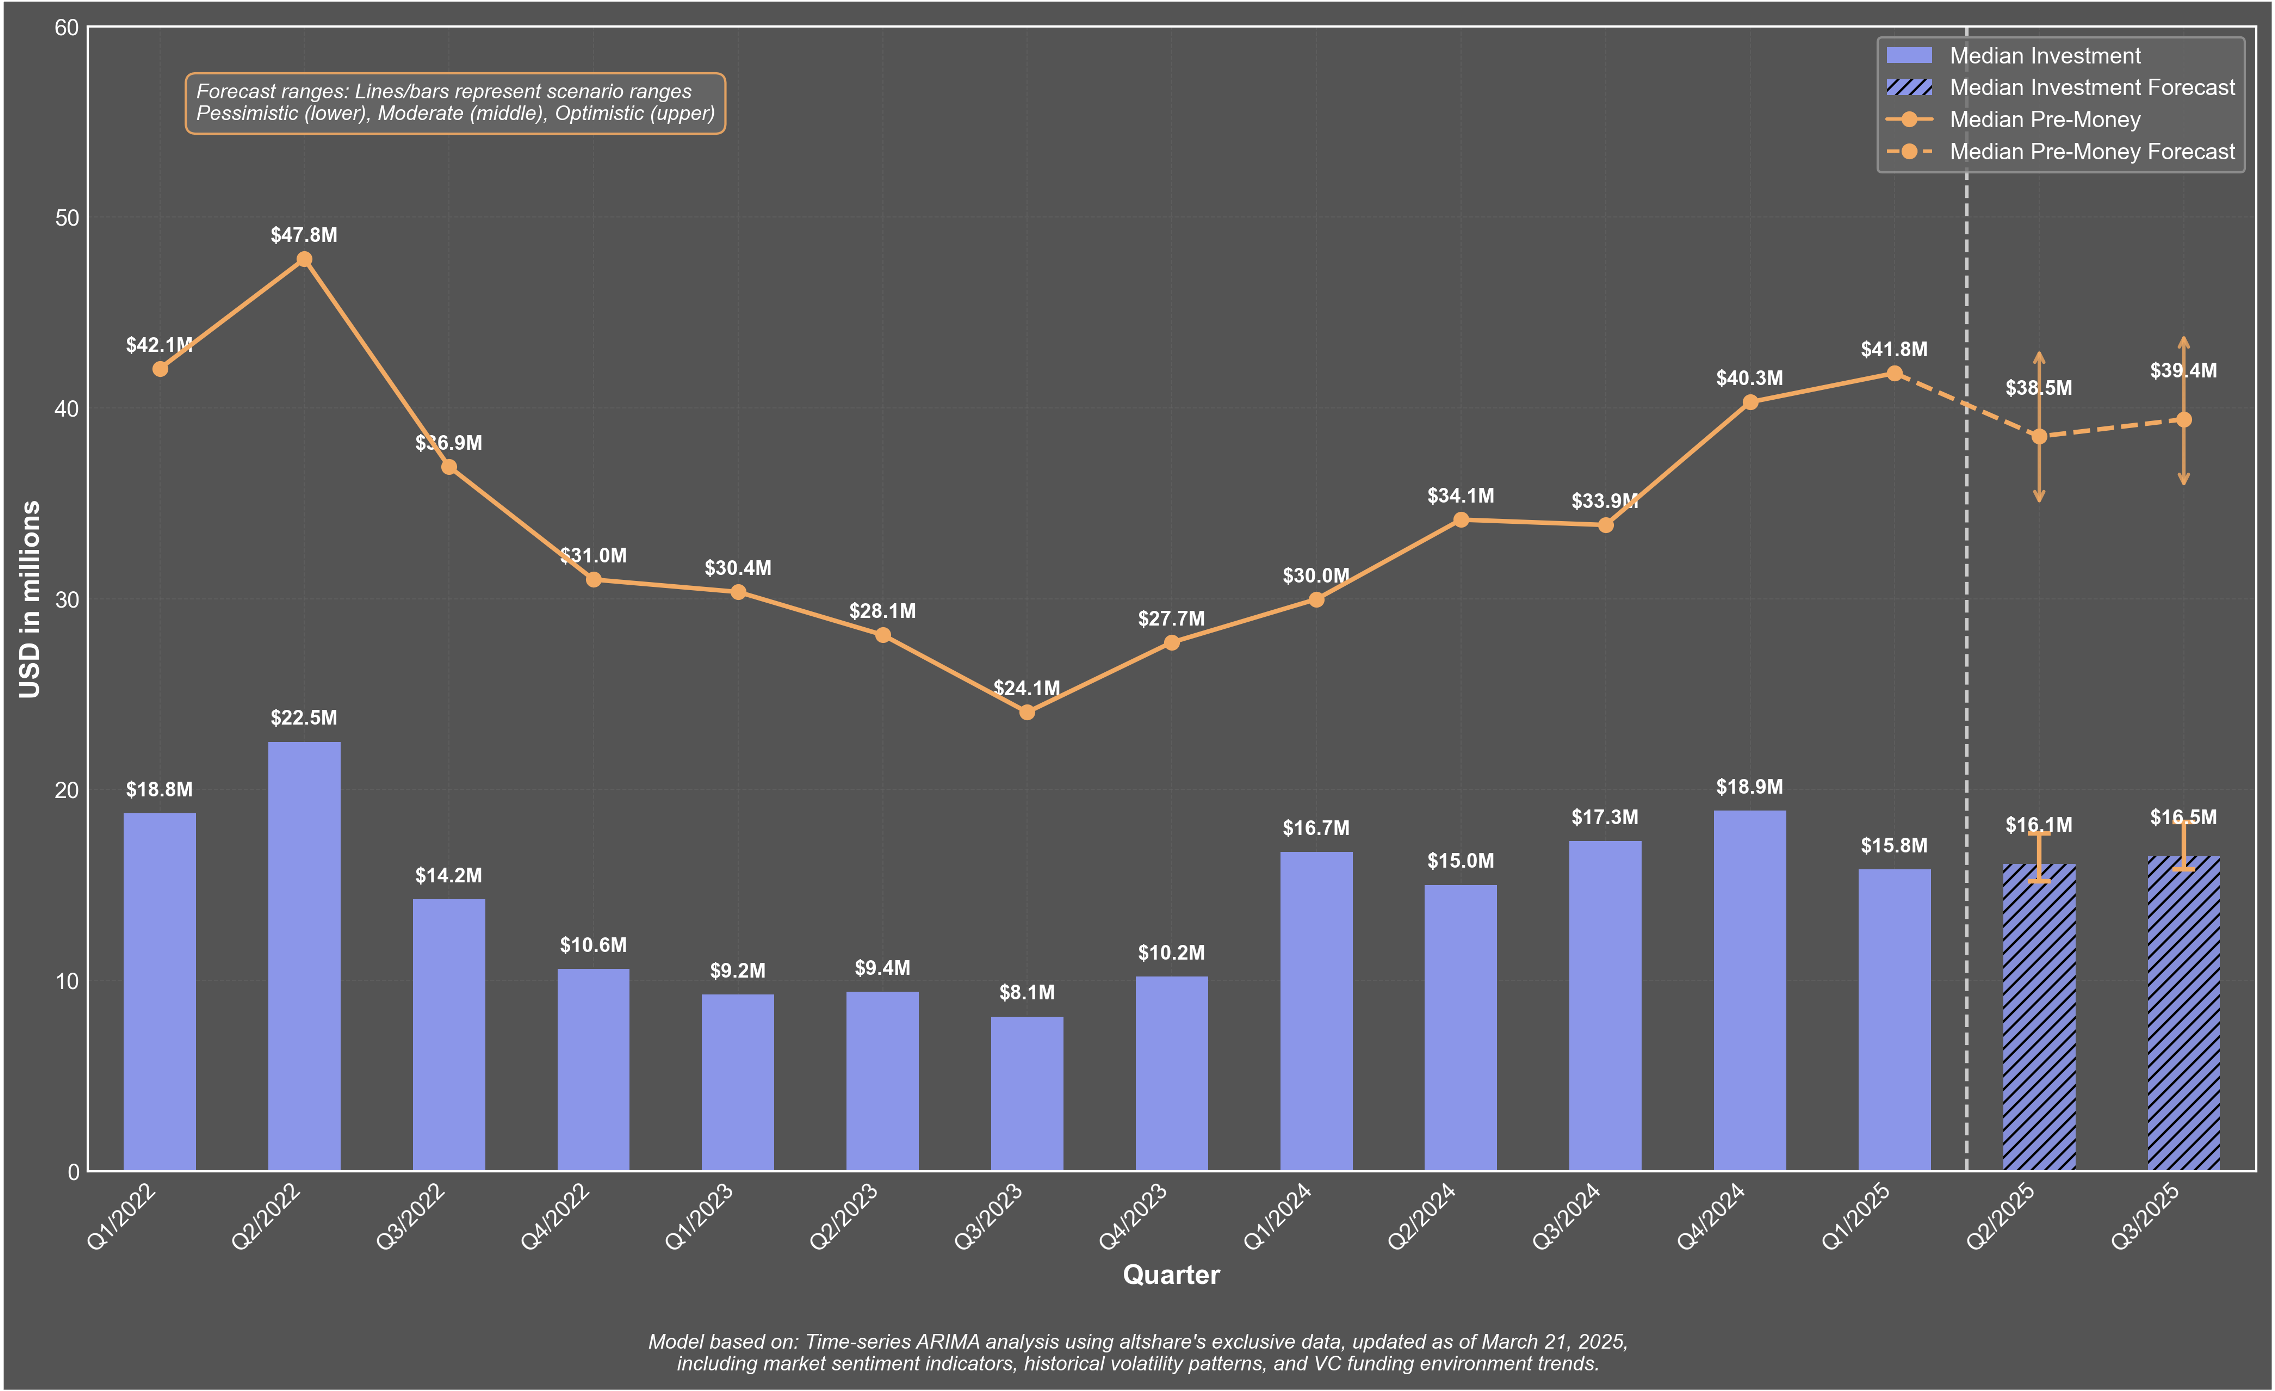
Between 2022 and 2023, there was a significant shift in the Seed and Series A funding landscape, mainly due to economic pressures and global events. However, by mid-2024, the market began to stabilize. Notably, AI has not only bounced back but is actually leading the recovery, especially in Series A funding where valuations and deal sizes have surpassed the average. Investors are increasingly focused on sectors with long-term potential, and AI is at the forefront of this trend. As of early 2025, the market outlook is positive, with expectations of steady capital flow and ongoing strong valuations, particularly for high-performing sectors.
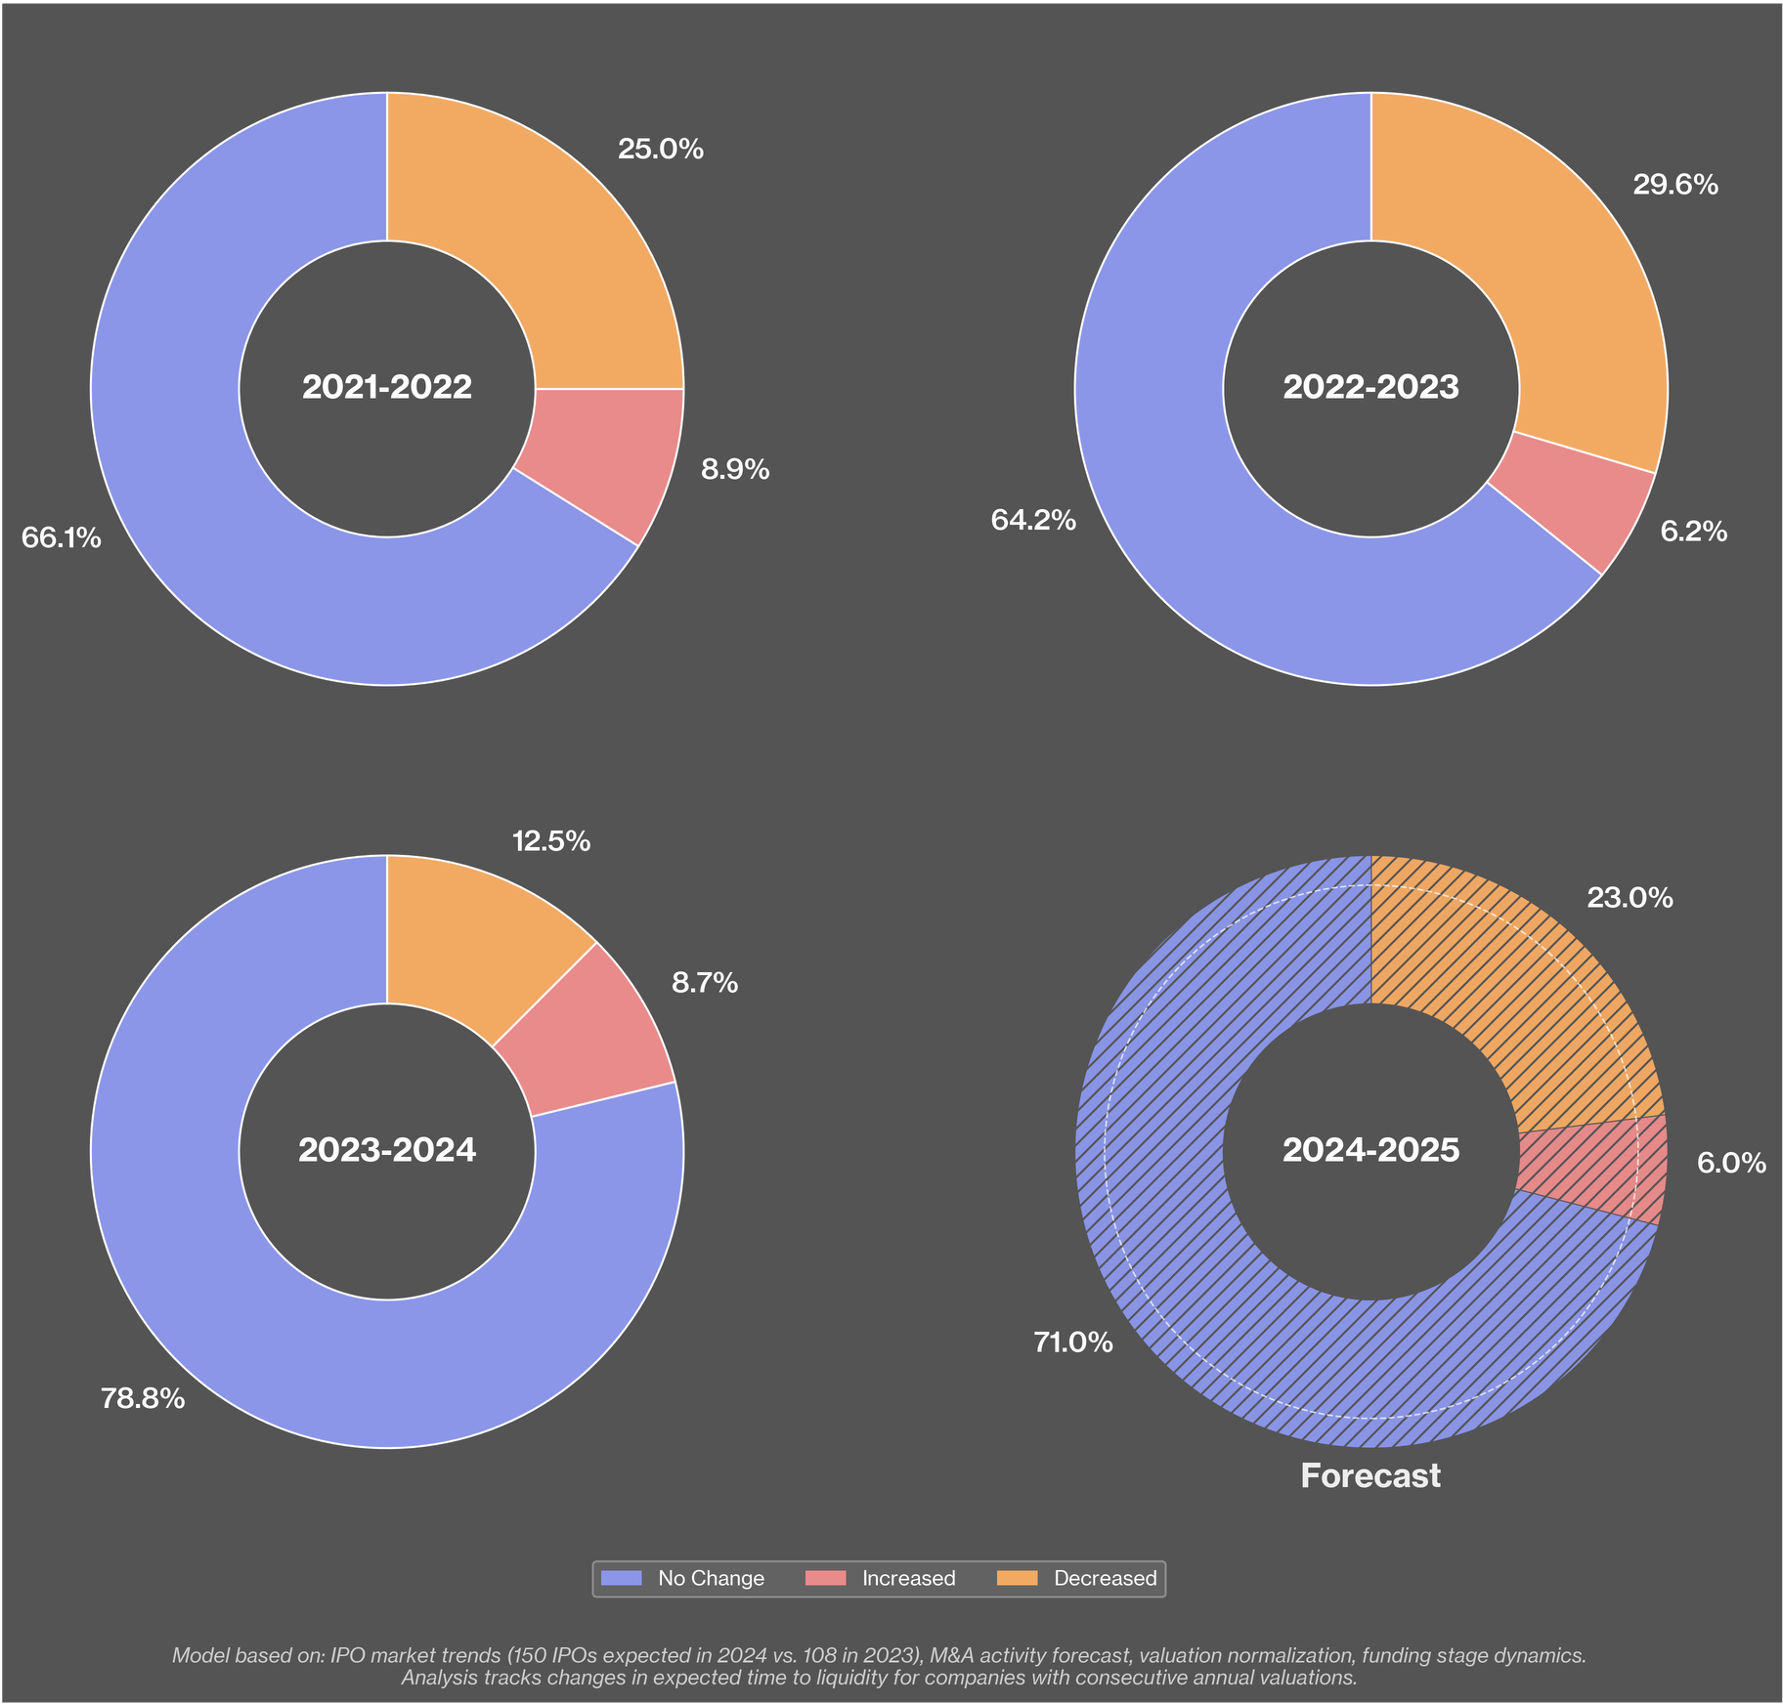
Time to Liquidity (TTL) represents the anticipated duration until a startup achieves an exit event, which allows for the conversion of equity into cash for both investors and founders.
From Bottleneck to Breakthrough: Changes in TTL
The period from 2023 to 2024 proved to be quite challenging for startups. Many companies reported "No Change" in their Time to Liquidity (TTL) expectations, indicating that they faced stagnation or delays and struggled to move closer to their exit goals. In fact, only 12.5% of startups decreased their expected TTL during this time, highlighting the challenges prevalent in the market.
Looking ahead to the 2024-2025 forecast, there's a more optimistic outlook. The share of startups that are reducing their expected TTL has nearly doubled to 23.0%. This increase is a sign of growing market confidence and suggests that conditions for exits are improving. It also aligns with expectations for a rise in IPOs and merger and acquisition activity.
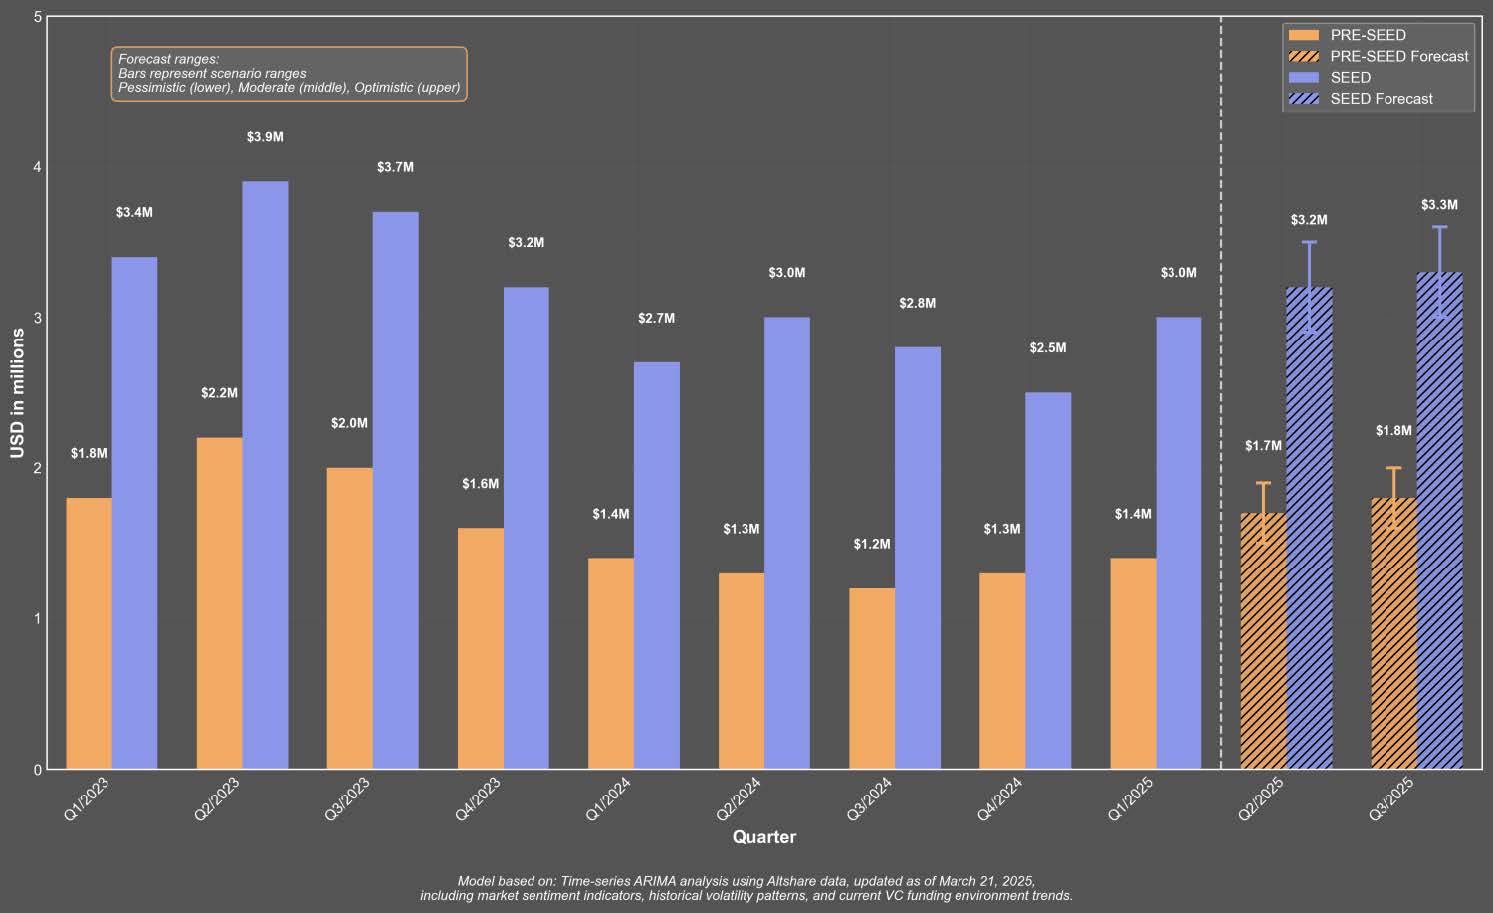
The State of Median SAFE Rounds:
Since early 2023, Pre-Seed SAFE rounds have fallen from $2.2M to $1.4M, and Seed rounds dropped from $3.9M to $3.0M. However, forecasts for Q2 and Q3 of 2025 suggest a slight recovery, with Pre-Seed expected to reach $1.7M to $1.8M and Seed around $3.2M to $3.3M, accordingly. The ongoing $1.5M gap between the two stages indicates disciplined investor behavior. Overall, while volume remains moderate, this stabilization hints at resilience in early-stage investments and a possible uptick in Pre-Seed activity.
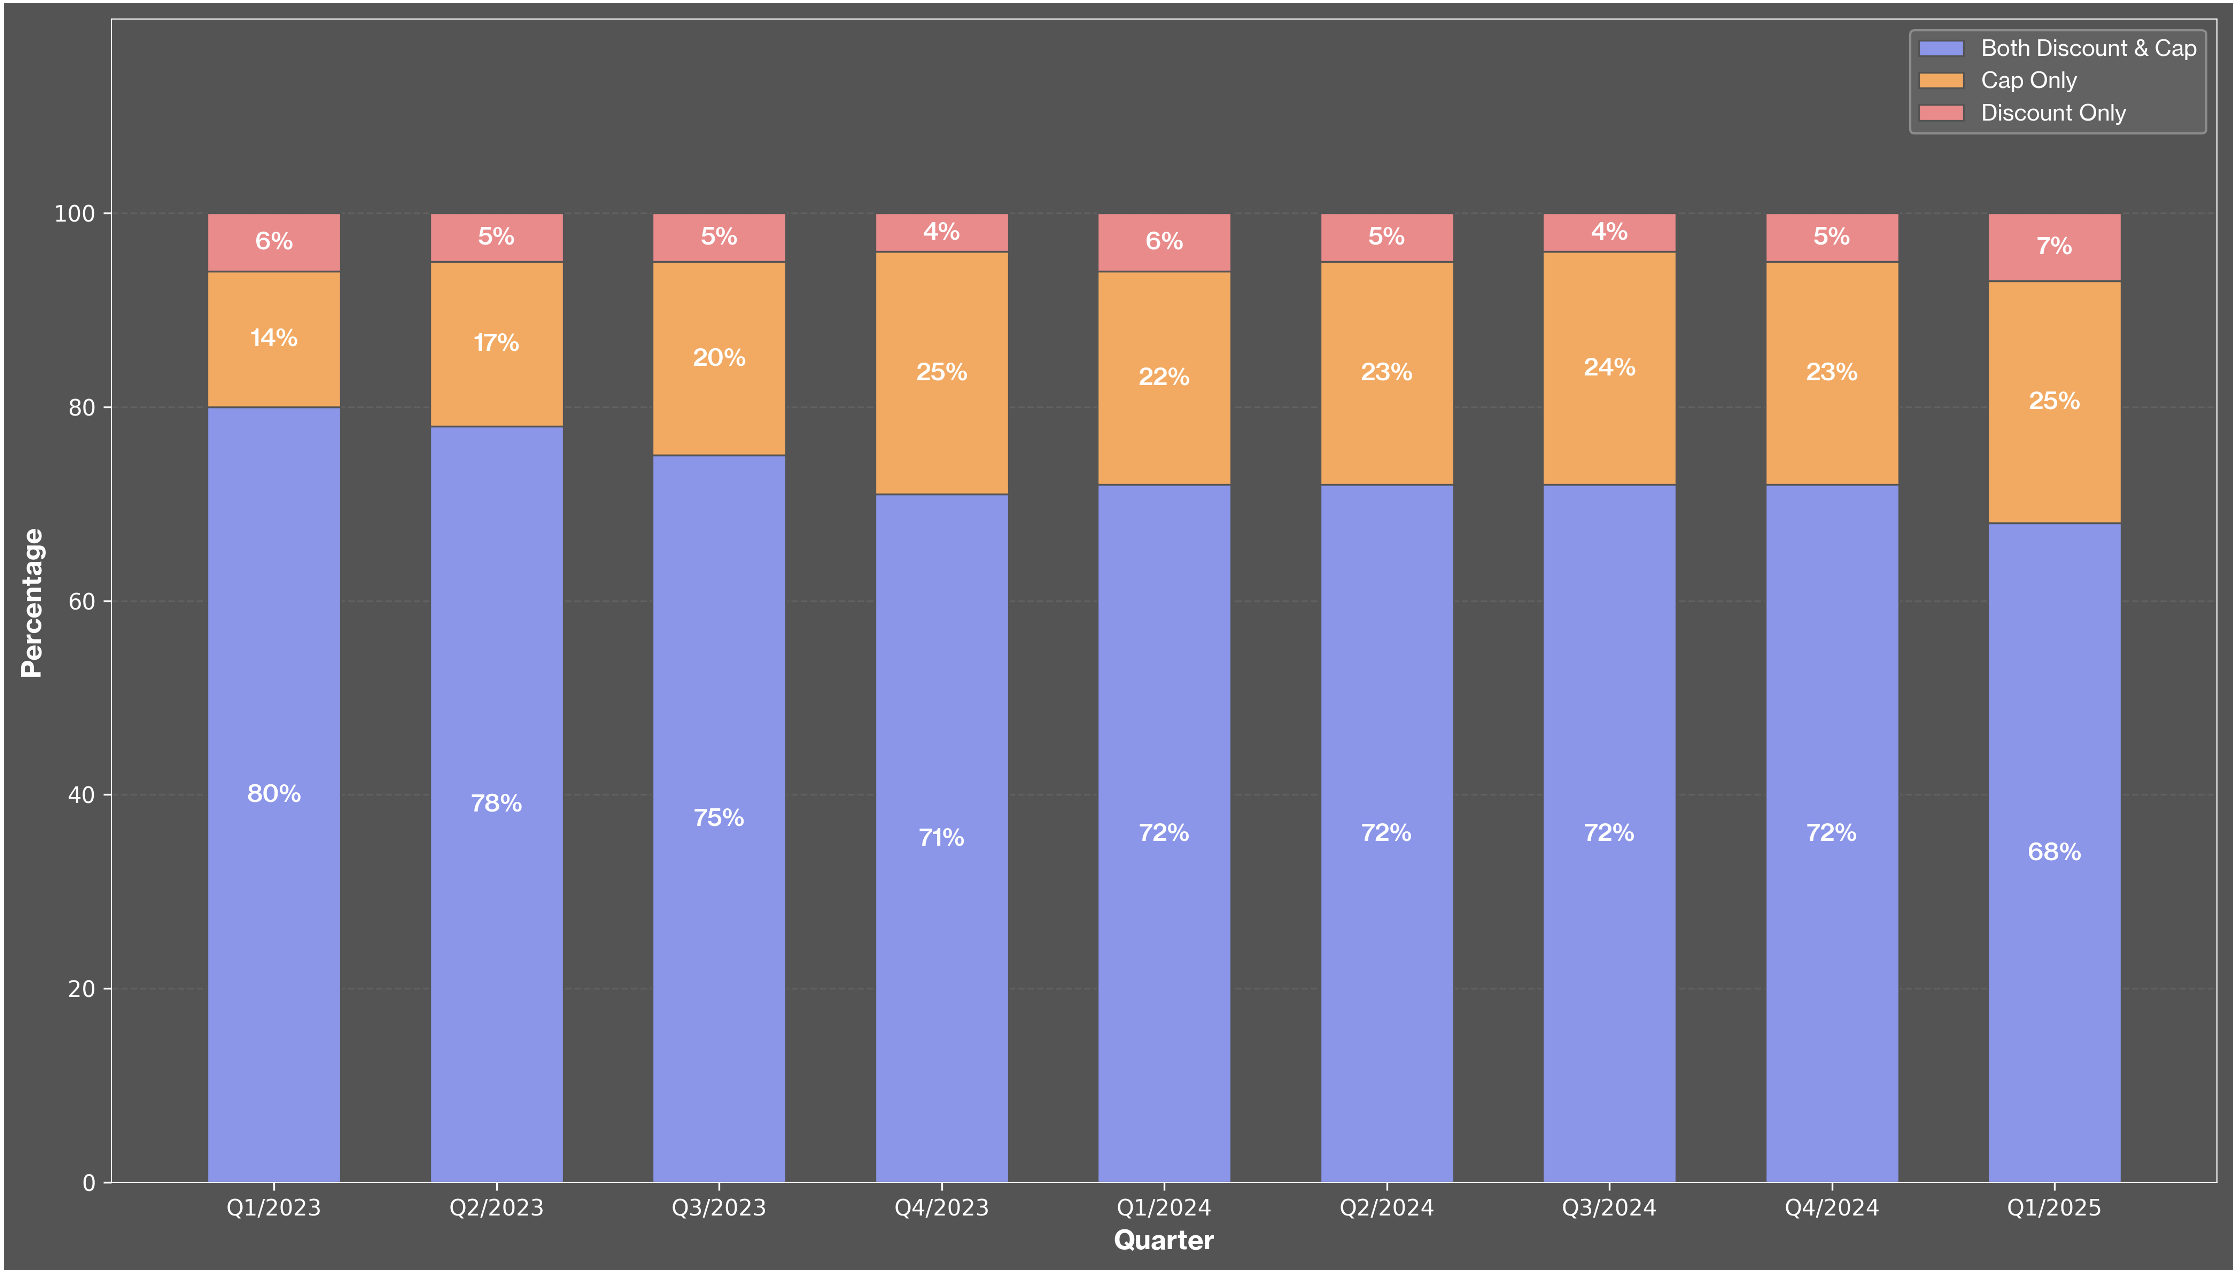
Rewriting the SAFE Rules:
From Q1 2023 to Q1 2025, there's been a noticeable shift in pre-seed SAFE agreements. The use of both discounts and valuation caps has declined from 80% to 68%. At the same time, SAFEs with a cap only have increased from 14% to 25%, indicating that founders prefer simpler cap-driven structures. While discount-only SAFEs remain rare, they have slightly risen to 7%. Compared to the Seed stage, pre-seed SAFEs are more conservative and focused on caps, suggesting that early-stage deals favor options that provide clearer valuation and protect investors from risks.
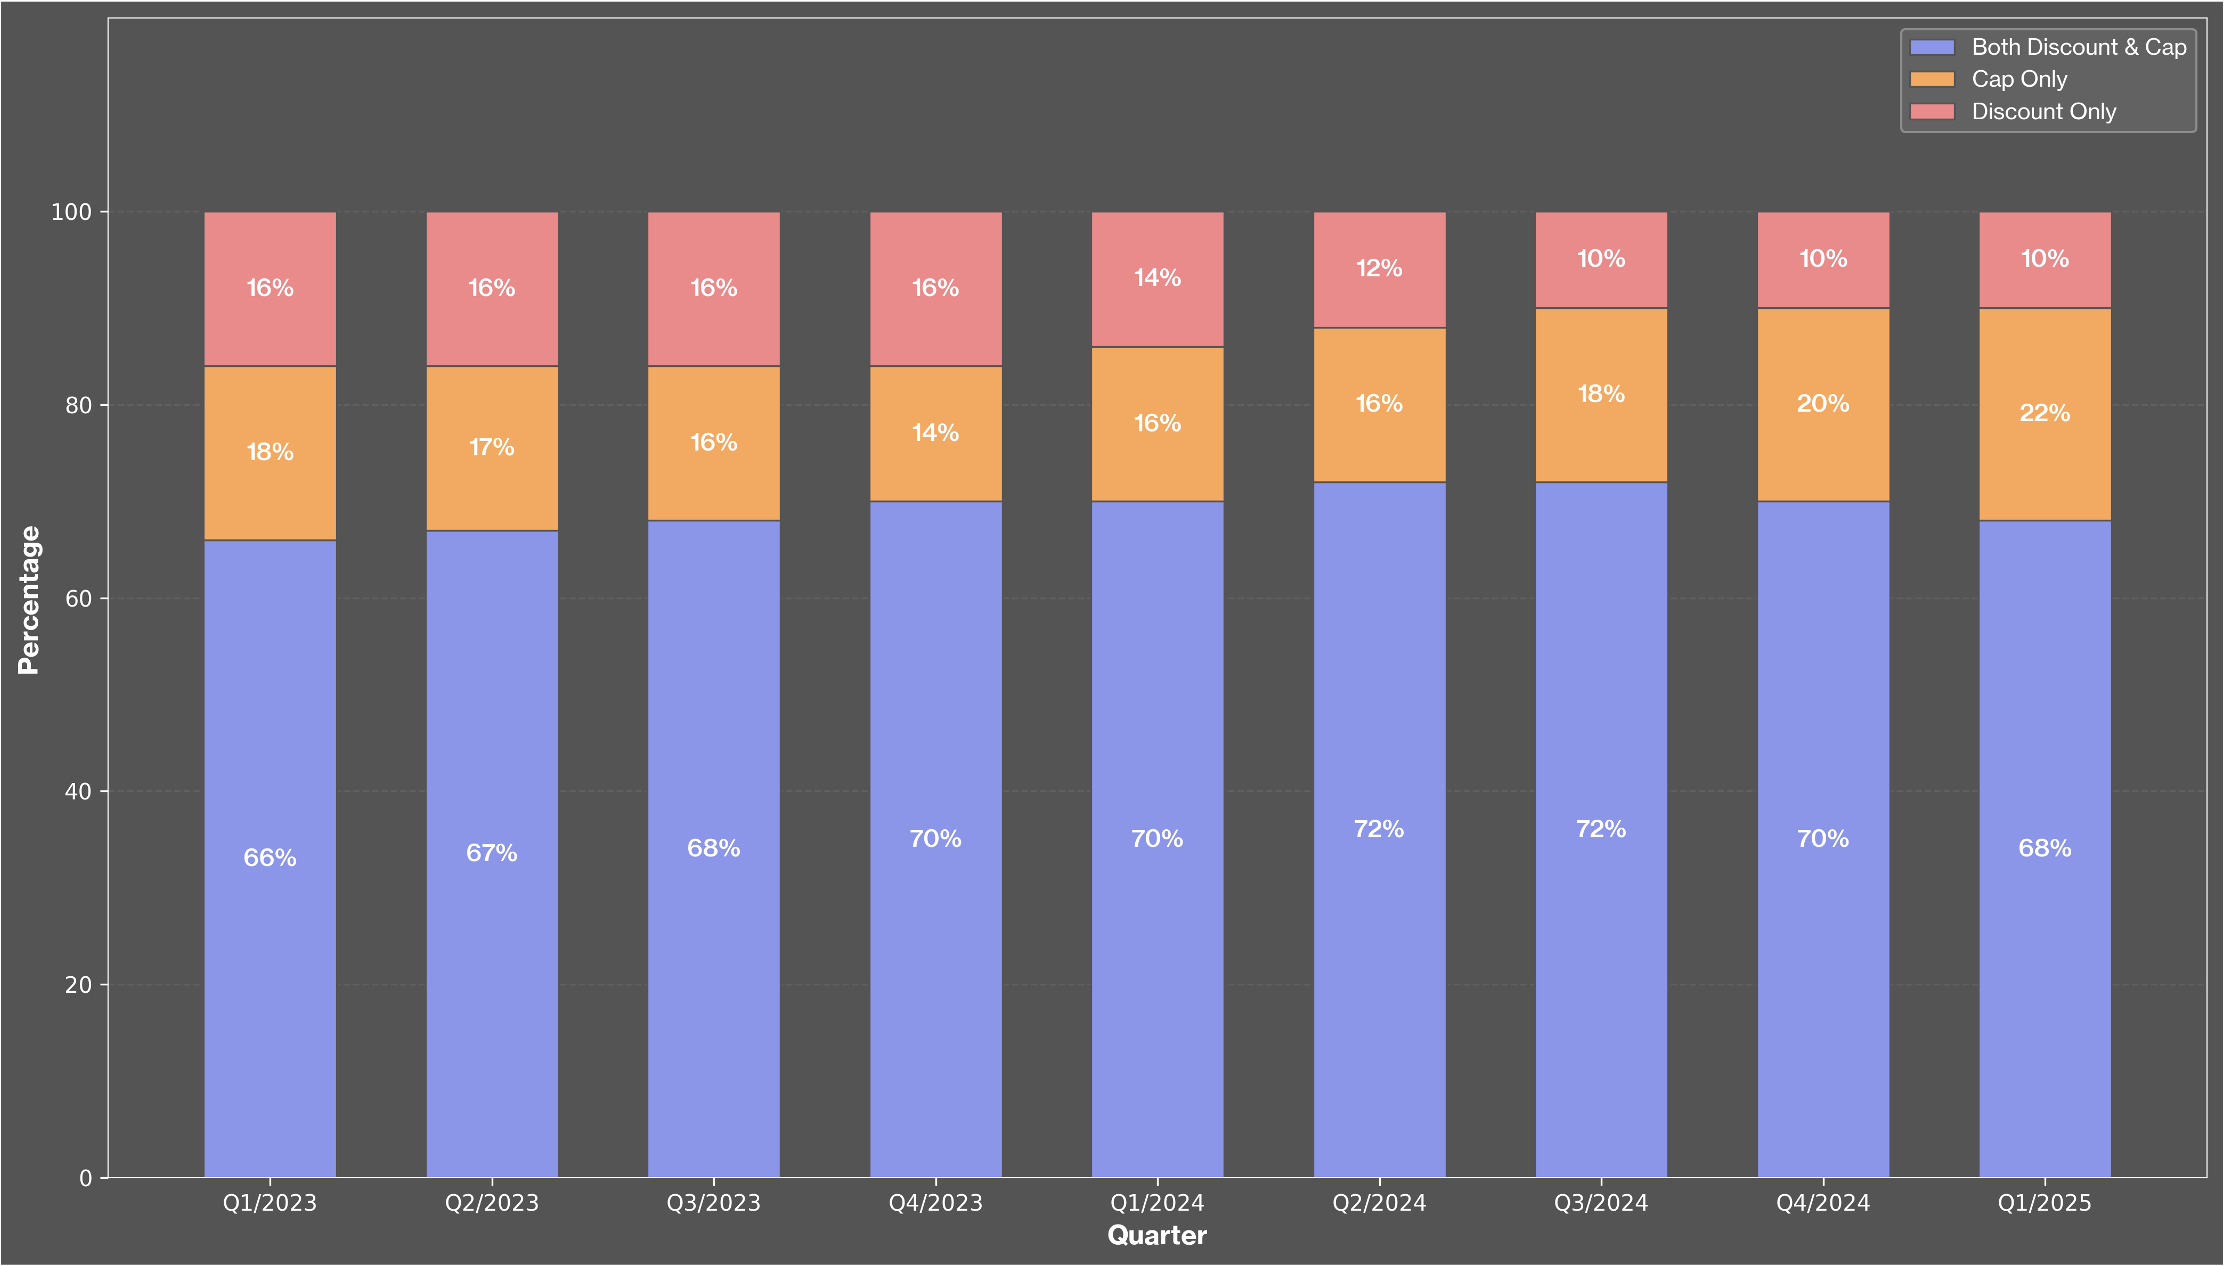
Some Rise Some Disappear - The New Seed SAFE Playbook:
In the Seed stage, SAFEs with both cap and discount have consistently stayed approximately 70% from Q1 2023 to Q1 2025. The percentage of cap-only SAFEs increased from 18% to 22%, following a trend seen in pre-seed rounds. Meanwhile, discount-only SAFEs declined from 16% to 10%, showing a move away from those instruments. Overall, Seed SAFEs indicate slightly more investor leverage, starting with more discount-only options and gradually shifting toward cap-only structures.
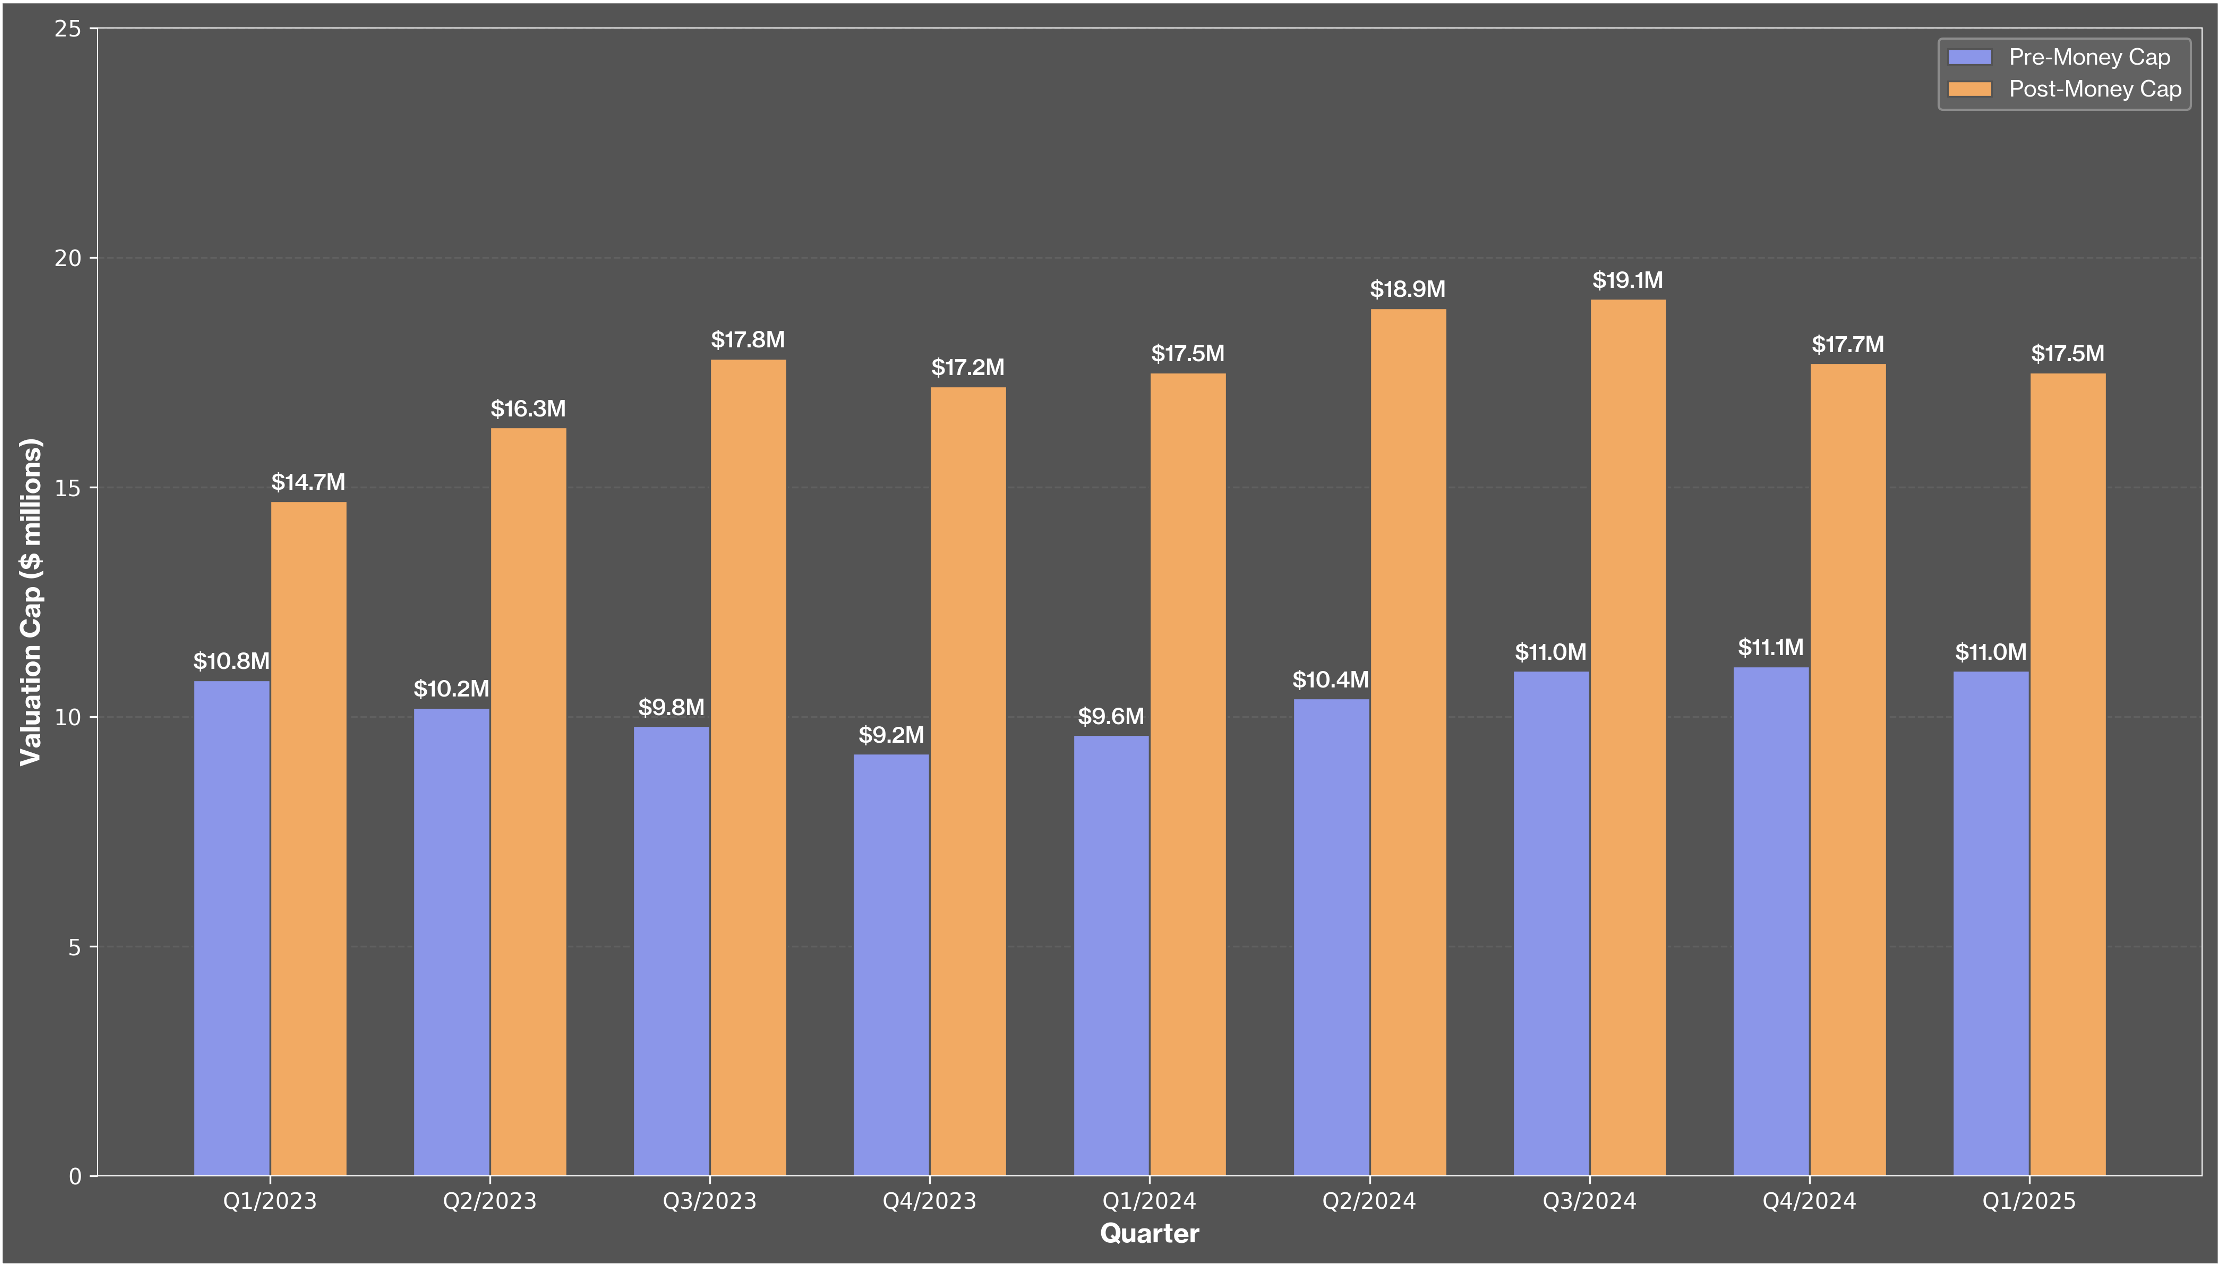
Steady Caps, Bigger Gaps
Between Q1 2023 and Q1 2025, pre-seed SAFE agreements kept their valuation caps pretty steady. Pre-money caps generally stayed between $9.2 million and $11.1 million. Meanwhile, post-money caps saw a sharper rise, peaking at $19.1 million in Q3 of 2024, then dropping to $17.5 million by Q1 of 2025. This growing gap suggests investors want more control over their stakes in early-stage startups.
Overall, it looks like investors are willing to accept higher valuations as long as they have clarity on valuation and conversion terms.
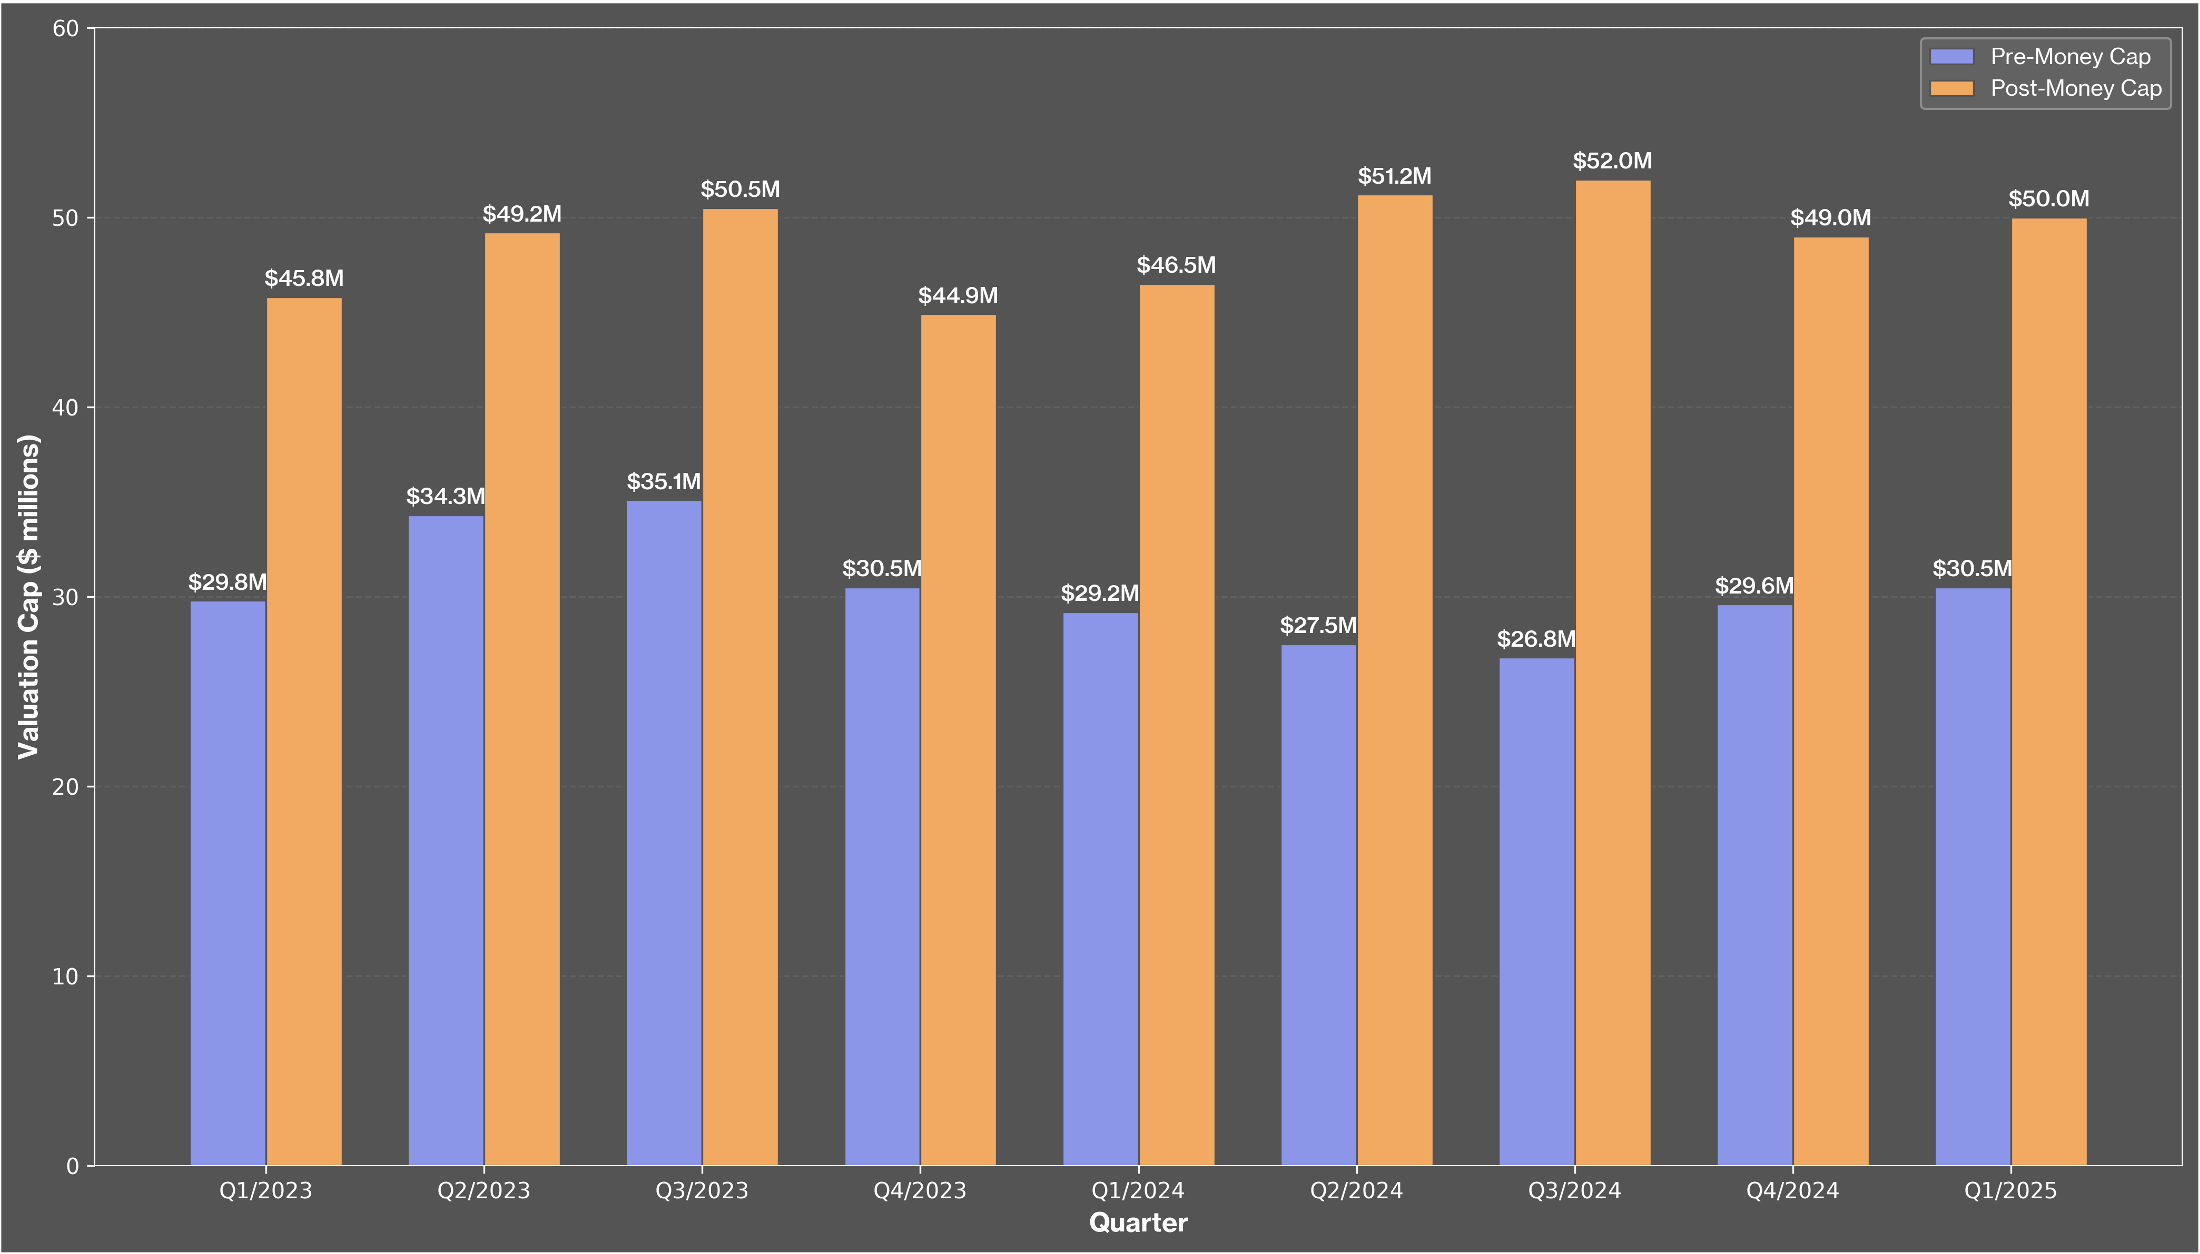
$50M Post-Money Caps: The New Normal?
Seed-stage SAFEs look quite different in scale. In 2023, pre-money caps were between $29.8M and $35.1M, down to $30.5M in 2025.
Meanwhile, post-money caps have consistently remained around $50M.
While pre-money valuations showed some volatility, post-money caps have stayed stable, indicating steady investor expectations.
Seed deals involve larger valuations and more defined equity exposure compared to pre-seed SAFEs, with a tighter range in caps reflecting improved pricing discipline in the market.
Tradition vs. Flexibility in pre-seed discount trends
Between Q1 2023 and Q1 2025, most pre-seed SAFEs kept a fixed 20% discount, representing 70% to 84% of deals each quarter. However, a gradual shift is evident: discounts over 20% rose from 5% to 15.5%, while those below 20% held steady around 10% to 13%. This suggests more flexibility in deal structuring and possibly increased investor leverage as startup risks are reassessed. Still, the 20% benchmark remains strong, indicating a continued reliance on traditional SAFE standards in early negotiations.
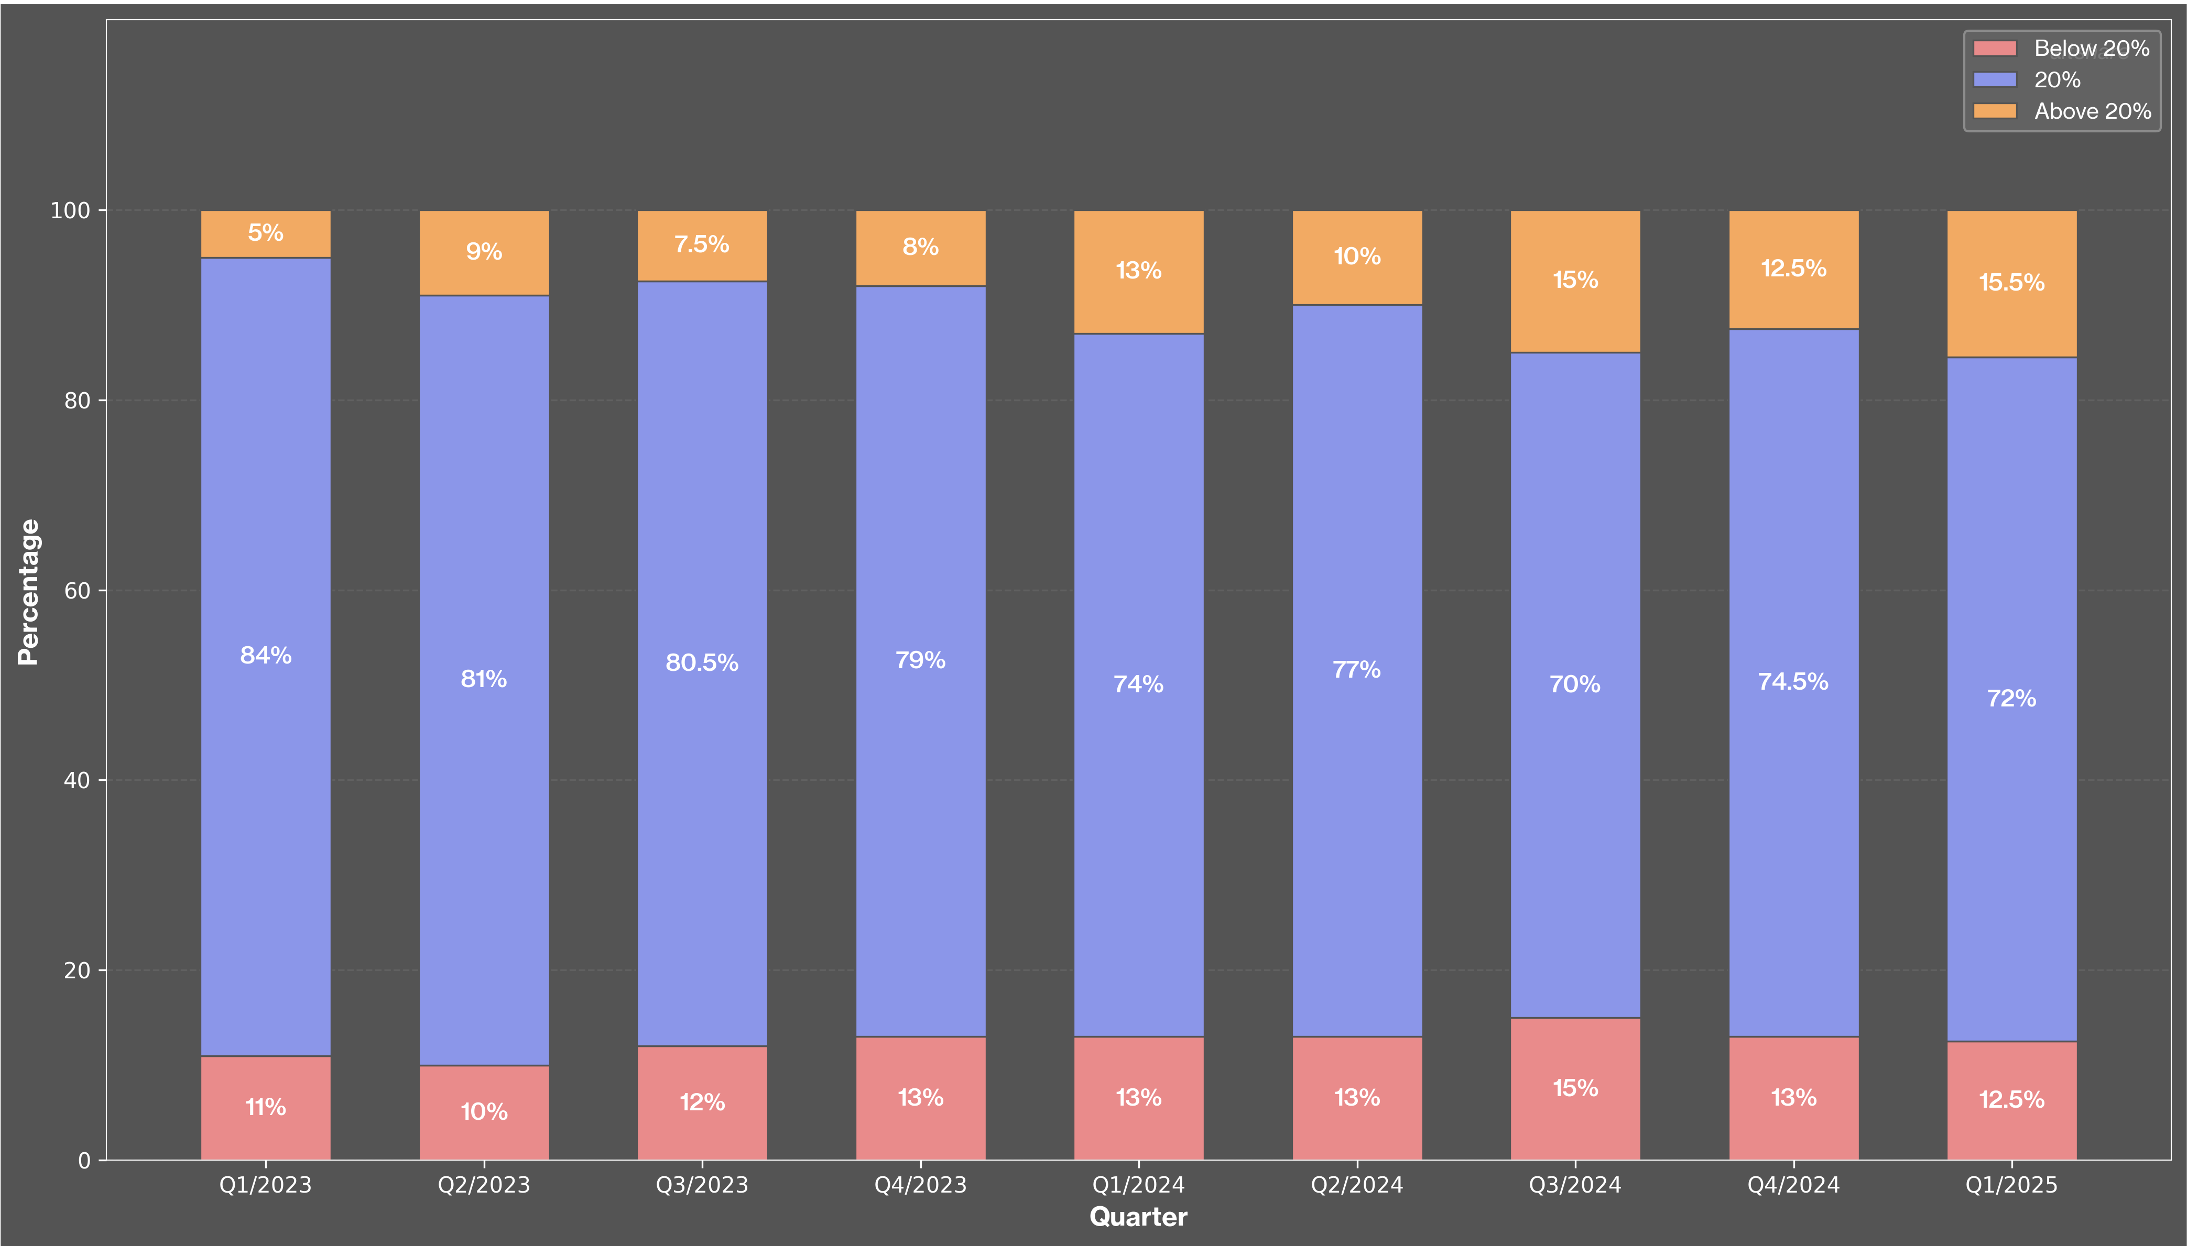
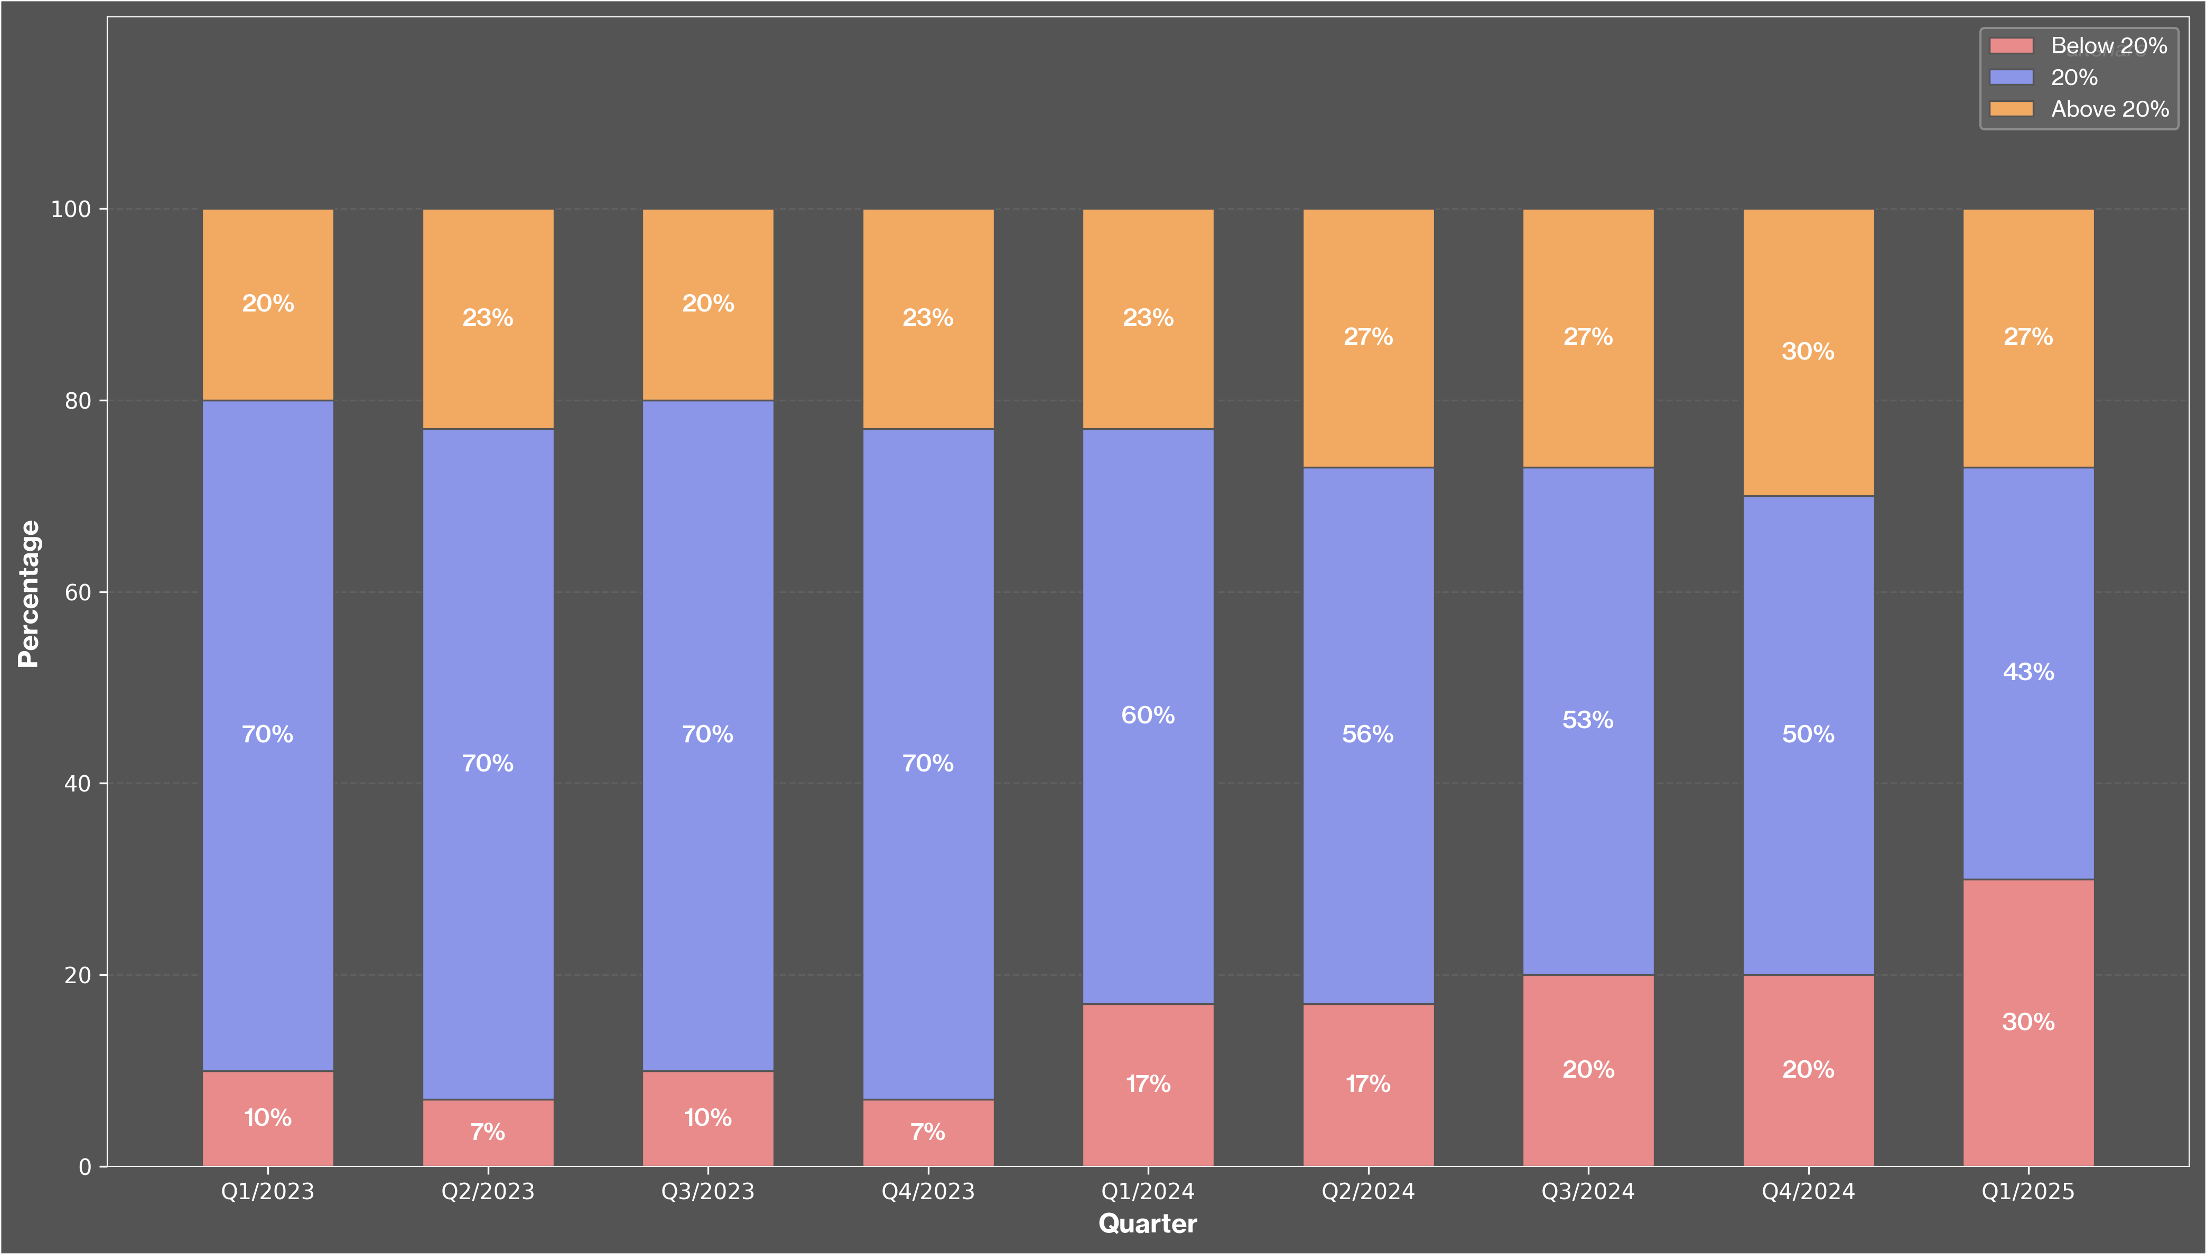
Discounts Break Away from the 20% Norm
In Seed rounds, the use of 20% discounts has dropped significantly from 70% in early 2023 to just 43% by Q1 2025.
Simultaneously, SAFEs with discounts over 20% have increased from 20% to around 27%, while discounts below 20% have surged from10% to 30%. This shift indicates a trend toward more customized deals, likely influenced by competitive factors and changing investor priorities.
Compared to pre-seed SAFEs, Seed stage deals show greater variability and strategic discounting, reflecting its unique position between validation and growth stages.
The SAFE landscape for Pre-Seed and Seed rounds is evolving, moving towards simpler, cap-based instruments, with this trend being more pronounced at the pre-seed stage. As competition for capital intensifies, pre-seed rounds are increasingly favoring clarity and straightforward negotiations, stepping away from the complex structures that combine caps and discounts. In Seed rounds, the relevance of discount-only SAFEs is diminishing. This shift suggests that investors are increasingly seeking clear valuations and more defined conversion terms. The convergence of these structures across stages signals a broader normalization in the market, highlighting a collective push toward transparency and predictability in early-stage funding.
When examining valuation caps, further insights emerge. Pre-seed SAFEs have maintained stable pre-money caps between $9.2 million and $11 million, while post-money caps peaked around $19.1 million before stabilizing. The widening spread between cap types indicates a subtle shift in leverage towards investors, with less aggressive valuation increases. Conversely, Seed SAFEs operate on a larger scale, as pre-money caps fluctuate between $26.8 million and $35.1 million and post-money caps consistently hover around $50 million. This stark contrast highlights the anticipated valuation uplift at the Seed stage, as investors refine their expectations for ownership outcomes in a tighter funding environment.
The discount rate structures provide more insight into the evolving negotiations. For pre-seed SAFEs, the standard 20% discount remains prevalent, with 70% to 84% of deals adhering to this rate throughout 2023 and into 2024. However, in late 2024 and early 2025, there was a modest uptick in discounts exceeding 20%, possibly reflecting increased risk perceptions or negotiation imbalances. Seed SAFEs display more variability; the use of the 20% benchmark has decreased to just 43% by Q1 2025, while both sub 20% and above 20% discounts have gained traction. This trend indicates a bifurcation in strategies, where some founders are successfully negotiating lighter dilution while others are accepting steeper discounts.
Overall, the Israeli SAFE market is undergoing a significant transformation. Pre-seed deals emphasize investor protection and standardized structures, while Seed rounds exhibit greater customization, driven by sector maturity and investor expectations. By mid 2025, early-stage fundraising is likely to reflect market realism and strategic discipline, with SAFEs continuing to serve as a flexible tool in a maturing venture ecosystem.
About altshare
altshare is a leading, fast-growing Equity Management & Compensation Plans Administration solutions provider. We love challenges. We are obsessed with our clients. We are on a mission to redefine the way founders do equity. All our products & services are supported through the altshare Platform - the only equity management platform built for entrepreneurs.


